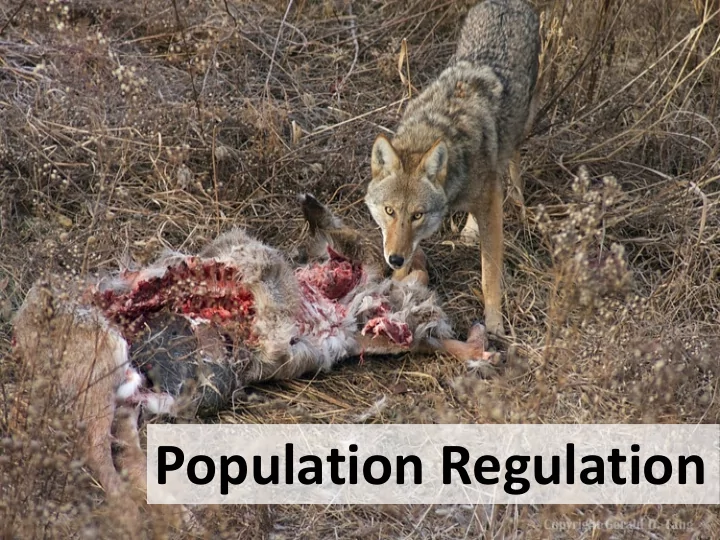

Population Regulation
The logistic equation suggests that factors limiting growth exert stronger effects on mortality and fecundity as a pop. grows.
What are these factors, and how do they operate?
Many things influence rates of pop. growth, but only density-dependent factors are thought to be able to regulate the size of a pop.
Conceptually . . .
What about density- independence?
Reproductive of white-tailed deer in 5 regions of New York State, 1939-1949. Percentage of females Embryos per Corpora lutea Region a pregnant female per ovary Western 94 1.71 1.97 Catskill periphery 92 1.48 1.72 Catskill central 87 1.37 1.72 Periphery 86 1.29 1.71 Adirondack center 79 1.06 1.11 a Regions arranged by decreasing suitability of range.
Percentage of females Embryos per Corpora lutea Region pregnant female per ovary Western 94 1.71 1.97 Catskill periphery 92 1.48 1.72 Catskill central 87 1.37 1.72 Periphery 86 1.29 1.71 Adirondack center 79 1.06 1.11
Percentage of females Embryos per Corpora lutea Region pregnant female per ovary Western 94 1.71 1.97 Catskill periphery 92 1.48 1.72 Catskill central 87 1.37 1.72 Periphery 86 1.29 1.71 Adirondack center 79 1.06 1.11
Reproduction of white-tailed deer in the Debar Mountain area of the Adirondack Mountains of New York before and after hunting. Percentage of Embryos per Corpora lutea females female per ovary pregnant 1939-1943 (prehunting) 57 0.71 0.60 1947 (after heavy hunting) 100 1.78 1.86
What about density independence? Cold weather caused fish kills on the Texas Gulf Coast in winter, 1948. Commercial catch Locality Before After % decline Matagorda 16,919 1,089 98.6 Aransas 55,224 2,552 95.4 Lagunda Madre 2,016 149 92.6
Some Review Questions
When a population of organisms is just starting to fill up its habitat, the growth rate is nearly purely exponential. a. True b. False
Probably the most serious oversimplification inherent within the logistic growth model is: a. inbreeding may lead to increased homozygosity and loss of fertility b. mature individuals may have difficulty finding mates c. when N is large, growth is slow d. at very low N , population growth is highest e. r is a constant
As population density increases, there is a tendency for the individual birth rates to decline and the individual death rates to increase. This change in either b or d , or in both, is known as: a. intraspecific competition b. interspecific competition c. density dependence d. density independence e. optimal functioning
What would a graph of independent and dependent birth rates look like if you plotted pop. size on the horizontal axis and birth rate (per individual) on the vertical axis?
What would a graph of independent and dependent death rates look like if you plotted pop. size on the horizontal axis and death rate (per individual) on the vertical axis?
Which of the following situations is the best example of density independent population changes. Time 1 Time 2 N Birth rate Death rate N Birth rate Death rate A 100 0.3 0.1 500 0.1 0.1 50 3.0 2.0 300 3.0 2.0 B 500 0.4 0.4 100 0.6 0.3 C 25 1.0 0.1 200 1.0 0.5 D E 200 0.3 0.2 50 0.6 0.2
Questions?
Recommend
More recommend