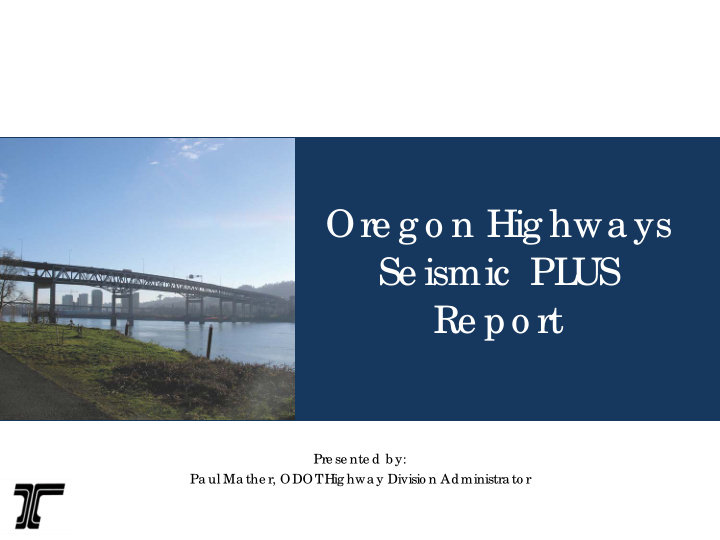


Ore g o n Hig hwa ys Se ismic PL US Re po rt Pre se nte d b y: Pa ul Ma the r, ODOT Hig hwa y Divisio n Administra to r
Clic k to a dd te xt
T he Ore g o n Re silie nc e Pla n Required by the legislature, Transportation is supported by critical Governor Comprehensive plan, developing a strategic approach
Co nc e pts Strategic planning is Retrofit increases critical to success resiliency if done and will require incrementally & widespread strategically consensus Secondary loss of life and long term economic losses can be significantly reduced
T he so lutio n RETROFIT For serviceability For life safety to to keep the bridge prevent collapse functional
Hig hwa y Bridg e L o sse s
Mo de ra te I-5 Marquam Bridge
Mo de ra te I-405 Fremont Bridge
Co lla pse US 26 Ross Island Bridge
Co lla pse Astoria-Megler Bridge
Co lla pse US 30 Longview-Rainier Bridge
Co lla pse I-5 Interstate Bridge
Slig ht to Mo de ra te I-205 Glenn Jackson Bridge
Re tr ofitting pr og r e ss F irst 16 ye a rs sinc e vulne ra b ility wa s ide ntifie d Years Actions 1994/1997 Prioritized total bridge needs 1155 1985-2012 Phase 1 retrofit added to projects 355 (STIP & OTIA III program) bridges addressed Bridges still needing retrofitting Future 800 (About 200 years at current funding)
Most br idg e s be yond de sig n life 900 800 700 600 Number of Bridges 500 400 300 200 100 0 <1950 1950-1959 1960-1969 1970-1979 1980-1989 1990-1999 2000-2009 2010-2014 Bridges remaining in service
OT IA br idg e inve stme nt ne e ds to c ontinue
• Identify strategic lifeline routes • Minimize long term economic damage • Address overall bridge -Oregon Highway Seismic condition Options Report
Ro ute se le c tio n Survivability • Emergency responders • Critical care facilities Life Support • Critical care facilities • Life support resources • Evacuation routes Economic Recovery • Critical freight corridors • Mobility into and out of the region • Routes between large metro areas
Re c o mme nde d life line ro ute s
T o ta l Se ismic PL US Pro g ra m Co st Program Total Bridge Cost Landslides/Rockfalls Cost Total Seismic PLUS Phases Program Costs 1 $738 Million $197 Million $935 Million 2 $632 Million $272 Million $904 Million 3 $612 Million $483 Million $1,095 Million 4 $640 Million $126 Million $766 Million 5 $1,432 Million $0 $1,432 Million Total $4.1 Billion $1.0 Billion $5.1 Billion
Ma jo r Se ismic E ve nt: I so la te d Are a s Total economic loss: $350 B
I so la te d Zo ne s: Pha se 1 & 2 Sc e na rio Reduce economic loss by: $35 B
I so la te d Zo ne s: F ull Se ismic Pro g ra m Reduce economic loss by: $84 B
No n-distre sse d b ridg e s with Se ismic PL US funding le ve ls Predicted Percent of Non-Distressed Bridges with 'Seismic Plus' Funding Levels (2010 - 2060) 100% 80% Target 80% Percent Non-Distressed 60% 40% 20% Seismic Plus Current Funding Level 0% 2010 2020 2030 2040 2050 2060 Year Out of 2681 State Owned NBI Bridges
Cost = $5.1 Billion Economic Loss Avoided = $250 Billion
We ne e d to sta r t NOW T ra nspo rta tio n is ke y to the o ve ra ll re spo nse Seismic Retrofit by State 5147 Bridges 416 Bridges 143 Bridges $13 Billion $177 Million $44 Million
Ore g o n Re silie nc e Pla n Re c o mme nda tio ns Be g in imme diate ly to pre pare c ritic al state hig hway b ridg e s and the transpo rtatio n syste m to withstand a majo r e arthq uake . • Additional revenue be identified to complete the most critical routes. • Funding source should be “pay as you go.” • Research to ensure the most current technology and efficient methods are applied. • Conduct a thorough inventory and assessment of transit, port and rail assets.
Recommend
More recommend