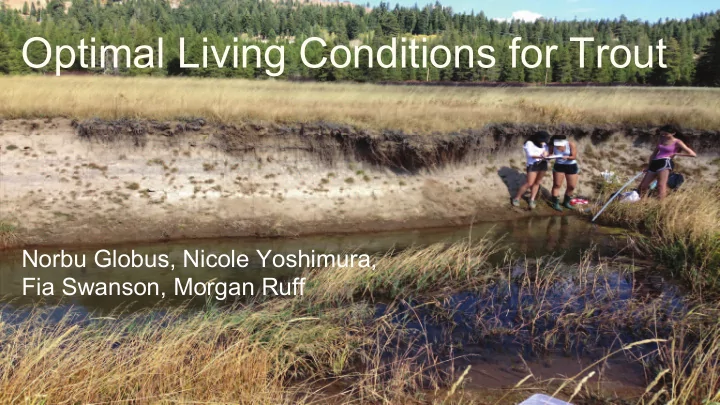

Optimal Living Conditions for Trout Norbu Globus, Nicole Yoshimura, Fia Swanson, Morgan Ruff
Purpose/ Guiding Questions How do different abiotic conditions in each pool affect the organisms which live there? Why did we find so few organisms at certain sites? What are the optimal living conditions for trout?
Photo Gallery
Background Information: Abiotic Review general optimal pH values: 6.7-8.6 optimal pH range for freshwater fish: 5.5-7.2 optimal alkalinity levels: 50-200 ppm degrees of hardness: 0-60 ppm is soft 61-120 ppm is moderately hard 121-180 ppm is hard
Background Information: Biotic Review Trout! cool deep pools (high levels of D.O.) Algae found in eutrophic waters high levels of nutrients (nitrate) -> assimilated by algae - > algal growth
Methods Select Pools Find Pool Dimensions: width/length/depth Test Pool pH, alkalinity, hardness, nitrite/nitrate levels, turbidity, temperature Qualitative Observations: pool color, presence of organisms (algae, frogs, trout, catfish!!!!!)
Materials pH strips, Alkalinity strips Hardness strips. Nitrate/ Nitrite strips Secchi tube Thermometer Measuring Tape Measuring Stick
Results pt. 1
Results pt. 2
Turbidity Hypothesis : Higher turbidity (cloudiness) means lower number of trout (inverse), because turbidity can signify pollutants and organic matter. Results : There was no apparent relationship between turbidity levels and trout populations 0% correlation ranged from 0.92m - 1.2m+
Temperature Hypothesis : as temperature decreases, number of trout increase because low temperature means more dissolved oxygen as temperature increases, so does number of trout Results : pretty stable temperature in all pools ranged from 9.0 C to 12.5 C # of trout 13% correlation Ground Water!! little temperature variation cold temperature (ºC)
pH Hypothesis : As pH increases, the number of trout increases (direct) Results : As pH increases (becomes less acidic) trout population also increases. direct relationship # of pH range of 6.0-6.5 trout really strong correlation 48.1% ph Level further investigation!
pH is slightly low (acidic). Why? regular pH range: 6.7-8.6 regular pH range for freshwater fish: 5.5-7.2 pH level Our average pH levels: 6.2 range: 6-6.5 Nitrate level nitrate affects pH level: 11% correlation
Alkalinity Hypothesis : As alkalinity increases so does the number of trout (direct), because alkalinity is the neutralization of acids (CO2->carbonic acid -> bicarbonate/carbonate -> alkalinity) Results : alkalinity levels in EVERY pool= 0 ppm no apparent relationship between alkalinity and trout population
Low alkalinity. Why? Average alkalinity: 50-200 ppm Our alkalinity (for every site): 0 ppm Alkalinity: measurement of productivity (low alkalinity: low productivity) low productivity: few organisms (cellular respiration-> Carbon Dioxide-> Bi/carbonate-> alkalinity) Headwaters: few nutrients (pollutants) or caused by error
Nitrate vs. Trout Hypothesis : As nitrate levels increase, so will the number of trout (and algae!) Results : nitrate/trout correlation Pools with more observable trout had lower levels of nitrate nitrate levels ranges from 0-0.5ppm
Algal Growth and Nitrate Levels Sites 9 and 10 Algal Blooms! low levels of nitrate (0.3 and 0.1 ppm respectively) Nutrients (nitrate) assimilated by algae; results in crazy algal growth Numbers don’t look that different but the test color strips were!
Depth Hypothesis : As depth increases, trout population would increase as well (direct) Results : 26.7% correlation positive
Number of Trout vs. General Size (length/width) Small: Pool 2, Pool 5a, Pool 5b, -> between 0-2 trout Medium: Pool 6, Pool 7, Pool 8, Pool 4, Pool 10 -> between 10-30 trout Large: Pool 1, Pool 3, Pool 9 -> between 15-50 trout
Hardness Hypothesis: As hardness increases, the number of trout in pools will decrease because hardness indicates magnesium/calcium ions (from city runoff) Results: The hardness of EVERY pool=20 ppm no observable correlation between hardness and trout population 20 ppm is considered “soft” no city runoff
Discussion –Improvements Quantitative measuring of algae Measuring clearness/color using scale Location accuracy Experimental error Temperature Faulty pH/alkalinity/hardness strips (colors) Guesstimating on how many trout counted in each pool
Thank you!!!
Recommend
More recommend