Nine month report 2019 We build for a better society. - PowerPoint PPT Presentation
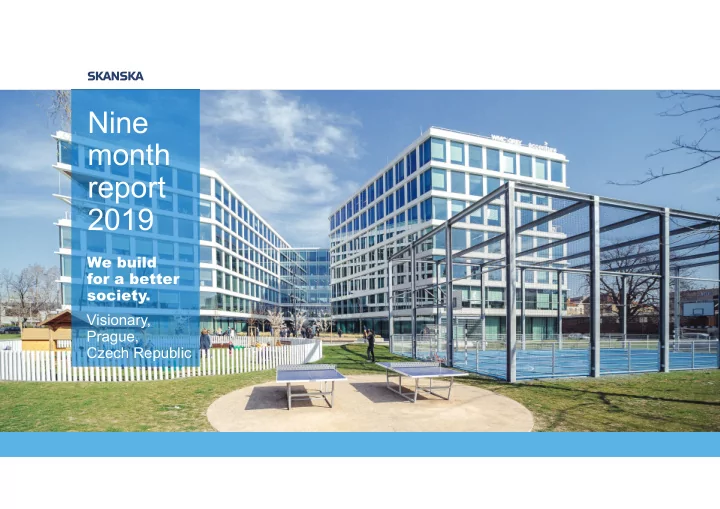
Nine month report 2019 We build for a better society. Visionary, Prague, Czech Republic Nine month report 2019 Solid third quarter Profitability further improved in Construction Steady underlying performance in Residential
Nine month report 2019 We build for a better society. Visionary, Prague, Czech Republic
Nine month report 2019 − Solid third quarter − Profitability further improved in Construction − Steady underlying performance in Residential Development despite a challenging market − Maintaining strong performance in Commercial Property Development − Operating margin in Construction 2.3% (0.2), YTD − ROCE in Project Development 10.6% (11.1), R-12 − Return on Equity 21.6% (9.8), R-12 − Slightly weaker but still supportive market outlook Visionary, Prague, Czech Republic November 7, 2019 Skanska nine month report 2019 2
Construction − Revenue SEK 117.2 bn (115.3) − Order bookings SEK 96.8 bn (102.6) − Book-to-build 91%, R-12 − Order backlog SEK 183.7 bn (Jun 30, 2019: 184.0) − Operating income SEK 2,680 M (231) − Operating margin 2.3% (0.2) − Underlying profitability continues to improve − Selective bidding E16 Bagn-Bjøørgo, Norway November 7, 2019 Skanska nine month report 2019 3
Residential Development − Revenue SEK 7.2 bn (6.6) − 2,328 (2,214) homes sold − 1,729 (2,725) homes started − Operating income SEK 818 M (1,122) − Operating margin 11.4% (17.0) − Stable underlying profitability around 10% − ROCE 9.5% (11.9), R-12 − Minor improvement in the Swedish market − Adapting to changed buying behavior – strong balance sheet supportive Urbani, Gothenburg, Sweden November 7, 2019 Skanska nine month report 2019 4
Commercial Property Development − Operating income SEK 2,020 M (1,788) − Gain on sale SEK 2,808 M (2,393), including JVs − ROCE 11.1% (10.6), R-12 − 46 ongoing projects − SEK 31.5 bn in investment value upon completion − 60% occupancy rate − 59% completion rate − 10 projects started first nine months − 261,000 sq m leased (246,000) − High level of interest from tenants and investors Two Drydock, Boston, USA November 7, 2019 Skanska nine month report 2019 5
Construction Order situation SEK bn 250 Book-to-build 91% 200 150 Order backlog 100 Order bookings, R-12 Revenue, R-12 50 Order bookings per quarter 0 Q4 Q1 Q2 Q3 Q4 Q1 Q2 Q3 Q4 Q1 Q2 Q3 Q4 Q1 Q2 Q3 Q4 Q1 Q2 Q3 2015 2016 2017 2018 2019 Jan–Sep Jan–Sep Jan–Dec SEK bn 2019 2018 2018 Revenue 117.2 115.3 157.9 Order bookings 96.8 102.6 151.7 Order backlog 183.7 186.3 192.0 E16 Bagn-Bjørgo, Norway November 7, 2019 Skanska nine month report 2019 6
Construction Order bookings Book- Jan–Sep Jan–Sep to-build, Months of SEK bn 2019 2018 R-12, % production Nordics 43.6 45.8 106 13 of which Sweden 29.4 24.6 114 13 Europe 12.7 22.2 65 10 USA 40.5 34.6 91 16 Total 96.8 102.6 91 13 E16 Bagn-Bjørgo, Norway November 7, 2019 Skanska nine month report 2019 7
Construction Income statement Operating margin, R-12, % Revenue, R-12, SEK bn 6 180 5 150 Revenue 4 120 3 90 Operating margin 2 60 1 30 0 0 -1 -30 Q4 Q1 Q2 Q3 Q4 Q1 Q2 Q3 Q4 Q1 Q2 Q3 Q4 Q1 Q2 Q3 Q4 Q1 Q2 Q3 2015 2016 2017 2018 2019 Jan–Sep Jan–Sep Jan–Dec SEK bn 2019 2018 2018 Revenue 117.2 115.3 157.9 Gross income 7.3 5.4 8.0 Selling and administrative expenses -4.6 -5.2 -7.0 Operating income 2.7 0.2 1.1 Gross margin, % 6.2 4.7 5.1 Selling and administrative expenses, % -3.9 -4.5 -4.4 Operating margin, % 2.3 0.2 0.7 E16 Bagn-Bjørgo, Norway November 7, 2019 Skanska nine month report 2019 8
Construction Income statement Operating income, SEK M Operating margin, % Jan–Sep Jan–Sep Jan–Sep Jan–Sep 2019 2018 2019 2018 Nordics 1,576 1,577 3.7 3.8 of which Sweden 846 1,192 3.4 4.8 Europe 455 -564 2.0 neg USA 649 -782 1.3 neg Total 2,680 231 2.3 0.2 E16 Bagn-Bjørgo, Norway November 7, 2019 Skanska nine month report 2019 9
Residential Development Income statement, segment reporting Operating margin, R-12, % Revenue, R-12, SEK bn 20 20 Operating margin 15 15 10 10 Revenue 5 5 0 0 Q4 Q1 Q2 Q3 Q4 Q1 Q2 Q3 Q4 Q1 Q2 Q3 Q4 Q1 Q2 Q3 Q4 Q1 Q2 Q3 2015 2016 2017 2018 2019 Jan–Sep Jan–Sep Jan–Dec SEK M 2019 2018 2018 Revenue 7,191 6,619 10,739 Gross income 1,318 1,619 2,181 Selling and administrative expenses -500 -497 -676 Operating income 818 1,122 1,505 Gross margin, % 18.3 24.5 20.3 Selling and administrative expenses, % -7.0 -7.5 -6.3 Operating margin, % 11.4 17.0 14.0 Urbani, Gothenburg, Sweden November 7, 2019 Skanska nine month report 2019 10
Residential Development Income statement Operating income, SEK M Operating margin, % Jan–Sep Jan–Sep Jan–Sep Jan–Sep 2019 2018 2019 2018 Nordics 684 1,003 10.7 17.1 of which Sweden 353 536 10.0 17.0 Europe 134 119 17.4 15.7 Total 818 1,122 11.4 17.0 Urbani, Gothenburg, Sweden November 7, 2019 Skanska nine month report 2019 11
Residential Development Homes started and sold Homes, R-12 5,000 Sold 4,000 Started 3,000 2,000 1,000 0 Q4 Q1 Q2 Q3 Q4 Q1 Q2 Q3 Q4 Q1 Q2 Q3 Q4 Q1 Q2 Q3 Q4 Q1 Q2 Q3 2015 2016 2017 2018 2019 Homes started Homes sold Jan–Sep Jan–Sep Jan–Dec Jan–Sep Jan–Sep Jan–Dec 2019 2018 2018 2019 2018 2018 1,729 2,725 4,480 2,328 2,214 3,653 Urbani, Gothenburg, Sweden November 7, 2019 Skanska nine month report 2019 12
Residential Development Homes in production Homes % 9,000 90 8,000 80 7,000 70 6,000 60 5,000 50 4,000 40 3,000 30 2,000 20 1,000 10 0 0 Q4 Q1 Q2 Q3 Q4 Q1 Q2 Q3 Q4 Q1 Q2 Q3 Q4 Q1 Q2 Q3 Q4 Q1 Q2 Q3 2015 2016 2017 2018 2019 Sold under construction Unsold under construction Unsold completed Sales rate IP Unsold Homes in production Of which sold, % completed homes Sep 30, 2019 Dec 31, 2018 Sep 30, 2019 Dec 31, 2018 Sep 30, 2019 Dec 31, 2018 6,508 7,539 70 68 176 314 Urbani, Gothenburg, Sweden November 7, 2019 Skanska nine month report 2019 13
Commercial Property Development Income statement, segment reporting Jan–Sep Jan–Sep Jan–Dec SEK M 2019 2018 2018 Revenue 10,787 9,189 16,271 Gross income 2,550 2,377 3,936 Selling and administrative expenses -673 -630 -928 Income from joint ventures and associated companies 143 41 61 Operating income 2,020 1,788 3,069 of which gain from divestments of properties 1 2,665 2,352 4,005 of which write downs/reversal of write downs -70 -3 -107 1 Additional gain included in eliminations 108 184 321 Two Drydock, Boston, USA November 7, 2019 Skanska nine month report 2019 14
Commercial Property Development Unrealized and realized gains, segment reporting SEK bn 10 9 8 7 6 5 4 3 2 1 0 Q4 Q1 Q2 Q3 Q4 Q1 Q2 Q3 Q4 Q1 Q2 Q3 Q4 Q1 Q2 Q3 Q4 Q1 Q2 Q3 2015 2016 2017 2018 2019 Unrealized gains in: Land Ongoing projects at completion Completed projects Realized gains, R-12 Two Drydock, Boston, USA November 7, 2019 Skanska nine month report 2019 15
Commercial Property Development Completion profile, unsold projects SEK bn % 12 100 86 90 10 75 80 68 70 62 8 60 50 6 50 42 40 4 30 20 2 8 8 10 2 0 0 0 0 0 Q3 Q4 Q1 Q2 Q3 Q4 Q1 Q2 Q3 Q4 Q1 Q2 Q3 Q4 2019 2020 2021 2022 Total investment at completion, unsold ongoing projects Completed unsold projects Weighted Occupancy rate, % Two Drydock, Boston, USA November 7, 2019 Skanska nine month report 2019 16
Commercial Property Development Leasing 000 sq m % 700 70 600 60 500 50 400 40 300 30 200 20 100 10 0 0 Q4 Q1 Q2 Q3 Q4 Q1 Q2 Q3 Q4 Q1 Q2 Q3 Q4 Q1 Q2 Q3 Q4 Q1 Q2 Q3 2015 2016 2017 2018 2019 Leasing, R-12 Occupancy rate, ongoing projects Degree of completion, ongoing projects Two Drydock, Boston, USA November 7, 2019 Skanska nine month report 2019 17
Group Income statement Jan–Sep Jan–Sep Jan–Dec SEK M 2019 2018 2018 Operating income from business streams 5,518 3,141 5,704 Central -141 -639 -811 Eliminations -2 -58 -66 Operating income 5,375 2,444 4,827 Net financial items -69 53 36 Income after financial items 5,306 2,497 4,863 Taxes -876 -406 -934 Profit for the period 4,430 2,091 3,929 Earnings per share, SEK 10.75 5.07 9.55 Tax rate, % 17 16 19 Visionary, Prague, Czech Republic November 7, 2019 Skanska nine month report 2019 18
Group PPP portfolio SEK bn Sep 30, 2019 Dec 31, 2018 Present value of cash flow from projects 5.0 4.7 Net present value of projects 3.9 3.6 Carrying amount -2.6 -2.5 Unrealized development gain 1.3 1.1 Cash flow hedge 0.5 0.3 Effect in unrealized Equity 1.8 1.4 Visionary, Prague, Czech Republic November 7, 2019 Skanska nine month report 2019 19
Group Cash flow SEK bn 10 8 6 Cash flow from 4 business 2 operations, quarterly 0 -2 Rolling 12 months -4 -6 Q4 Q1 Q2 Q3 Q4 Q1 Q2 Q3 Q4 Q1 Q2 Q3 Q4 Q1 Q2 Q3 Q4 Q1 Q2 Q3 2015 2016 2017 2018 2019 Jan–Sep Jan–Sep Jan–Dec SEK bn 2019 2018 2018 Cash flow from operations -4.5 -0.1 7.4 Dividend etc. -2.5 -3.5 -3.5 Cash flow before change in interest- bearing receivables and liabilities -7.0 -3.6 3.9 Visionary, Prague, Czech Republic November 7, 2019 Skanska nine month report 2019 20
Recommend


More recommend
Explore More Topics
Stay informed with curated content and fresh updates.