New wiiw forecast for Central, East and Southeast Europe, 2014-2016 - - PDF document

new wiiw forecast for central east and southeast europe
SMART_READER_LITE
LIVE PREVIEW

New wiiw forecast for Central, East and Southeast Europe, 2014-2016 - - PDF document

Wiener Institut fr The Vienna Institute for www.wiiw.ac.at Internationale International Economic Wirtschaftsvergleiche Studies Press Conference, 13 March 2014 New wiiw forecast for Central, East and Southeast Europe, 2014-2016 Investment


slide-1
SLIDE 1

Wiener Institut für Internationale Wirtschaftsvergleiche The Vienna Institute for International Economic Studies

www.wiiw.ac.at

Mario Holzner New wiiw forecast for Central, East and Southeast Europe, 2014-2016 Investment to the Rescue

Press Conference, 13 March 2014 

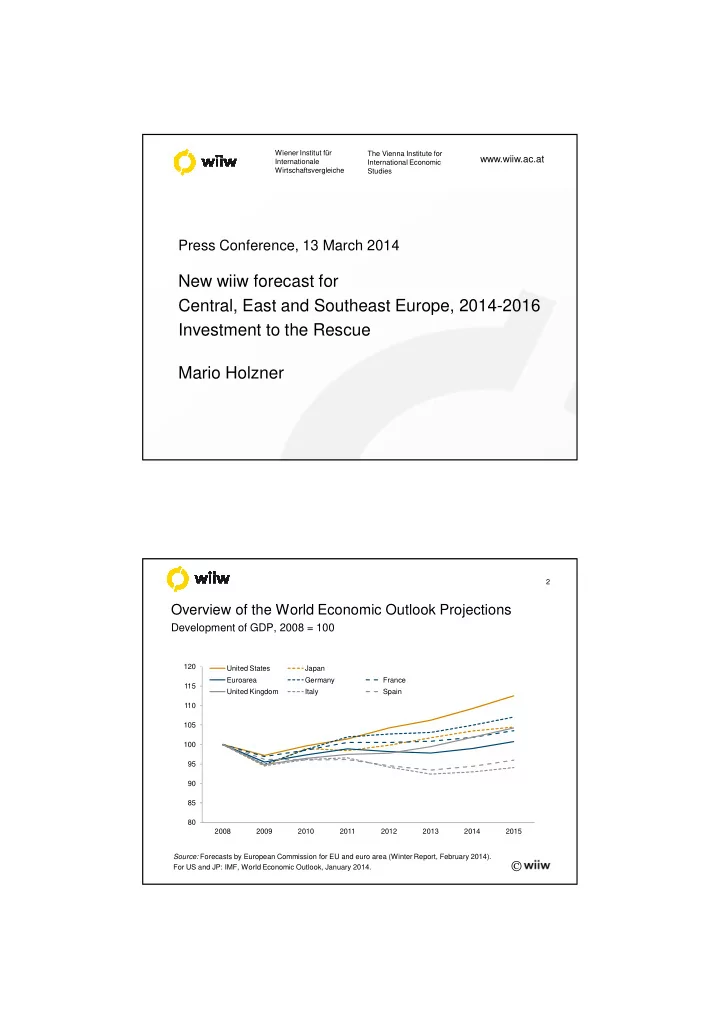
2 Source: Forecasts by European Commission for EU and euro area (Winter Report, February 2014). For US and JP: IMF, World Economic Outlook, January 2014.

Overview of the World Economic Outlook Projections

Development of GDP, 2008 = 100

80 85 90 95 100 105 110 115 120 2008 2009 2010 2011 2012 2013 2014 2015 United States Japan Euroarea Germany France United Kingdom Italy Spain

slide-2
SLIDE 2

3 Remark: Highlighted lines represent top 3 and bottom 3 countries referring to growth of 4th quarter 2013. Source: National and Eurostat statistics.

Development of quarterly GDP

real change in % against preceding year

  • 6
  • 4
  • 2

2 4 6 8 10 12 14 1q 2011 2q 2011 3q 2011 4q 2011 1q 2012 2q 2012 3q 2012 4q 2012 1q 2013 2q 2013 3q 2013 4q 2013 4q 2013 ranking RO KZ UA LT LV TR AL HU PL RS MK SI ME SK RU BA BG CZ EE HR test

4 Source: wiiw Monthly Database incorporating national and Eurostat statistics.

Consumer prices

change in % against preceding year

Range for other CESEE Serbia Turkey Kazakhstan Russia Average

  • 2

2 4 6 8 10 12 14 Jan-13 Feb-13 Mar-13 Apr-13 May-13 Jun-13 Jul-13 Aug-13 Sep-13 Oct-13 Nov-13 Dec-13

slide-3
SLIDE 3

5 Source: wiiw Monthly Database incorporating national and Eurostat statistics.

Imports of goods

change in % against preceding year, 2H2013 vs. 2H2012, current EUR

  • 12
  • 10
  • 8
  • 6
  • 4
  • 2

2 4 6 8 UA RU AL LV BA HR TR MK ME EE KZ CZ HU SI PL SK BG RO LT RS

6 Remark: HR, CZ, HU, SK, AL, BA, XK, MK, ME, RS: 2013 data for 3 quarters. BA, KZ and RU: already reporting according to IMF BOP Manual 6th edition. Source: wiiw Databases incorporating national statistics and Eurostat.

Current account (net), in % of GDP

  • 10
  • 5

5 10 BG HR CZ EE HU LV LT PL RO SK SI 2011 2012 2013

  • 20
  • 15
  • 10
  • 5

5 10 AL BA XK MK ME RS TR KZ RU UA 2011 2012 2013

slide-4
SLIDE 4

7

AL CZ HU PL RO RS BG EE HR LT LV SI SK

  • 6
  • 4
  • 2

2 Social exp. austerity, ∆ in pp. of GDP, 2012 vs. 2007 1 2 3 Capital investment austerity, ∆ in pp. of GDP, 2012 vs. 2007 Note: Positive values of expenditures, expressed in actual 2012 GDP percentage point differences between counterfactual ‘potential’ and actual shares, hint at fiscal austerity and reduced national income. Diamonds represent countries with fixed exchange rate regimes as opposed to flexible ones. Source: wiiw Annual database incorporating national and Eurostat statistics, own calculation.

General government social expenditure vs. capital investment austerity 

8 private = 9.4 - 0.0 * public + u R² = 0%

  • 40
  • 20

20 40 Private sector GFCF real change in %

  • 50

50 100 150 Public sector GFCF real change in % Source: National and Eurostat statistics, own calculations.

Public and private GFCF growth in 15 CESEE countries, (2000-2008)

slide-5
SLIDE 5

9 private = - 3.2 + 0.6 * public + u R² = 26%

  • 50

50 Private sector GFCF real change in %

  • 60
  • 40
  • 20

20 40 Public sector GFCF real change in % Source: National and Eurostat statistics, own calculation.

Public and private GFCF growth in 15 CESEE countries, (2009-2012) 

10

(Public) Investment leads the way out of the slump

  • Motorways, thermal and nuclear power plant projects in the pipeline
  • Intensive use of the remaining disbursement period 2014-2015 of the

EU MFF 2007-2013 & national co-financing

  • More public capital investment has the potential to spur subsequent

private investment

  • Improving growth prospects in the euro area are likely to encourage

CESEE export industries’ investment activity

slide-6
SLIDE 6

11 Remark: Average over available countries. Source: wiiw Monthly Database incorporating national and Eurostat statistics for industrial production. Eurostat and national statistics for industrial confidence.

CESEE gross industrial production and industrial confidence indicator

production change in % against preceding year / industrial confidence in pp.

  • 35
  • 30
  • 25
  • 20
  • 15
  • 10
  • 5

5

  • 30
  • 25
  • 20
  • 15
  • 10
  • 5

5 10 15 Jan-08 Jan-09 Jan-10 Jan-11 Jan-12 Jan-13 Jan-14 industrial production (lhs) industrial confidence indicator (rhs)

12 Remark: Ordered by 2014 growth rates. Source: For 2013 wiiw and national statistics as of March 2014. Forecast 2014 by wiiw.

GDP growth in 2013 & 2014 in %

and contribution of individual demand components in percentage points, flat household consumption countries

  • 4
  • 2

2 4 6 8 10 Serbia Bulgaria Hungary Czech Republic Albania Bosnia & Herzegovina Montenegro Romania Poland Slovakia GFCF investment Household final consumption Net exports GDP (growth in %)

slide-7
SLIDE 7

13 Remark: Ordered by 2014 growth rates. Source: For 2013 wiiw and national statistics as of March 2014. Forecast 2014 by wiiw.

GDP growth in 2013 & 2014 in %

and contribution of individual demand components in percentage points, dynamic household consumption countries

  • 4
  • 2

2 4 6 8 10 Ukraine Slovenia Croatia Russia Turkey Macedonia Estonia Lithuania Latvia Kazakhstan GFCF investment Household final consumption Net exports GDP (growth in %)

14 *Non-performing loans data for Hungary are for June 2013. Source: National Bank and Eurostat statistics, wiiw own calculations.

Non-performing loans in % of total loans (Sept. 2013) and stock of loans to the non-financial sector change in % against preceding year (avg. Dec. 2012 – Nov. 2013)

  • 20
  • 10

10 20 30 40 5 10 15 20 25 30 35 40 UA SI HR KZ HU* BG MK LT CZ LV SK PL RU TR EE NPL - Non-financial corporations NPL - Households Bank loans - Non-financial corporations (RHS) Bank loans - Households (RHS)

slide-8
SLIDE 8

15 Source: BIS.

Indices of foreign bank claims of Western European banks to CEE on ultimate risk basis, January 2008 = 100

50 60 70 80 90 100 110 Jun-08 Dec-08 Jun-09 Dec-09 Jun-10 Dec-10 Jun-11 Dec-11 Jun-12 Dec-12 Jun-13 Dec-13 Czech Republic Poland Slovakia Slovenia Hungary

16 Source: wiiw calculation incorporating national and Eurostat statistics.

Youth unemployment rate for age group 25-29, %,

  • avg. 1-3q 2013
slide-9
SLIDE 9

17

Summary

  • Upward reversal of public investment has potential to spur private
  • Motorways, thermal and nuclear power plant projects in the pipeline
  • Intensive use of remaining disbursement period 2014-2015 of EU MFF
  • euro area growth likely to encourage export industries’ investments
  • CESEE GDP to pick up speed and grow on average 2-3% 2014-2016

18 Source: wiiw forecast, March 2014.

GDP growth, current wiiw forecast for 2014-2016

2014 2015 2016 Kazakhstan 6.0 6.5 5.5 Kosovo 5.0 4.0 4.0 Latvia 4.2 4.1 3.9 Lithuania 3.6 3.8 4.0 Macedonia 3.0 3.0 3.0 Estonia 2.6 3.0 3.2 Poland 2.4 3.2 3.1 Romania 2.4 2.7 3.0 Slovakia 2.4 3.0 3.2 Turkey 2.2 3.5 4.5 Montenegro 2.1 2.9 3.0 2014 2015 2016 Bosnia and Herzegovina 1.9 3.0 3.0 Albania 1.7 1.5 1.0 Russia 1.6 2.3 3.0 Bulgaria 1.5 2.3 2.7 Czech Republic 1.4 2.4 3.0 Hungary 1.4 2.1 2.0 Croatia 0.0 1.0 1.5 Slovenia

  • 0.5

0.5 1.4 Serbia

  • 0.5

1.0 1.9 Ukraine

  • 1.1

0.9 1.8

slide-10
SLIDE 10

19 Source: National central banks.

Exchange rate development

RUB/USD, UAH/USD

Euromaidan start, 21.11.2013 Argentine peso crisis, 22.01.2014 Hryvnia peg abandoning, 07.02.2014 Russian aggression Crimea, 27.02.2014 7.5 8.0 8.5 9.0 9.5 10.0 10.5 31.5 32.5 33.5 34.5 35.5 36.5 RUB/USD (lhs) UAH/USD (rhs)

20

Ukraine: budget austerity on the agenda

  • Large external financing needs (approx. USD 35 bn, 2014-2015)
  • Russian credits agreed in Dec 2013 (USD 15 bn) have stalled
  • EU (USD 15 bn), USA (USD 1 bn), WB (USD 3 bn) promises
  • Ongoing negotiations over an IMF ‘rescue package’
  • But: IMF requires budget consolidation
  • Public expenditures to be cut by up to 17% in 2014
  • Energy tariff hikes for households
  • Pensions of working pensioners to be cut by 50%
  • Likely consequences: economic recession and rising social tensions
slide-11
SLIDE 11

21

Possible Crimea crisis effects

  • Annexation without shooting: most likely scenario, limited UA/RU trade

disruptions, little effects on CESEE, except maybe on ‘south stream’ countries (BG, RS, HU)

  • Annexation with shooting: less likely scenario, major UA/RU trade

disruptions, substantial effects on CESEE in terms of energy supply, trade, investment, interest rates

  • Super autonomy: less likely scenario, hardly any effects
  • Extensive EU trade and finance sanctions against Russia unlikely
  • Long-term effects: further energy diversification in CESEE, further EU

integration boost (e.g. PL & euro)

Wiener Institut für Internationale Wirtschaftsvergleiche The Vienna Institute for International Economic Studies

www.wiiw.ac.at

Mario Holzner New wiiw forecast for Central, East and Southeast Europe, 2014-2016 Investment to the Rescue

Press Conference, 13 March 2014