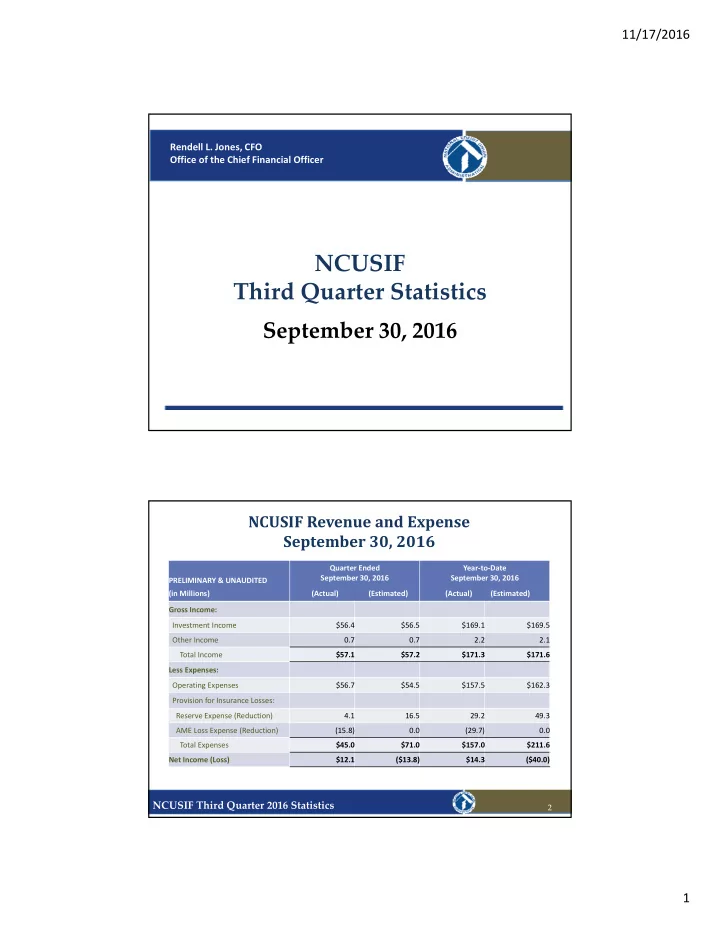

11/17/2016 Rendell L. Jones, CFO Office of the Chief Financial Officer NCUSIF Third Quarter Statistics September 30, 2016 NCUSIF Revenue and Expense September 30, 2016 Quarter Ended Year ‐ to ‐ Date September 30, 2016 September 30, 2016 PRELIMINARY & UNAUDITED (in Millions) (Actual) (Estimated) (Actual) (Estimated) Gross Income: Investment Income $56.4 $56.5 $169.1 $169.5 Year ‐ End 2009 Year ‐ End 2010 Other Income 0.7 0.7 2.2 2.1 Total Income $57.1 $57.2 $171.3 $171.6 Less Expenses: Operating Expenses $56.7 $54.5 $157.5 $162.3 Provision for Insurance Losses: Reserve Expense (Reduction) 4.1 16.5 29.2 49.3 AME Loss Expense (Reduction) (15.8) 0.0 (29.7) 0.0 Total Expenses $45.0 $71.0 $157.0 $211.6 Net Income (Loss) $12.1 ($13.8) $14.3 ($40.0) NCUSIF Third Quarter 2016 Statistics 2 1
11/17/2016 NCUSIF Summary Balance Sheets September 30, 2016 PRELIMINARY & UNAUDITED (In Millions) September 30, 2016 June 30, 2016 Assets Fund Balance with Treasury and Investments $12,741.0 $12,788.0 Notes Receivable, Net 69.4 109.2 Capitalization Deposits Receivable 384.7 ‐ Receivable from Asset Management Estates, Net 62.9 52.9 Accrued Interest and Other Assets 64.6 64.0 Total Assets $13,322.6 $13,014.1 Liabilities and Net Position Accounts Payable and Other Liabilities $ 12.0 $ 2.1 Insurance and Guarantee Program Liabilities 182.6 178.9 Net Position – Capital Deposits 9,989.9 9,613.8 Net Position – Cumulative Results of Operations 3,138.1 3,219.3 Total Liabilities and Net Position $13,322.6 $13,014.1 NCUSIF Third Quarter 2016 Statistics 3 NCUSIF Changes to the Reserves September 30, 2016 PRELIMINARY & UNAUDITED Quarter Ended Year ‐ To ‐ Date (In Millions) Sept 30, 2016 Sept 30, 2016 Beginning Reserve Balance: $178.9 $164.9 Year ‐ End 2009 Year ‐ End 2010 Reserve Expense (Reduction) 4.1 29.2 Charges for Assisted Mergers ‐ (2.0) Charges for Liquidations (0.4) (9.5) Ending Reserve Balance $182.6 $182.6 NCUSIF Third Quarter 2016 Statistics 4 2
11/17/2016 Treasury Yield Curve September 30, 2016 Sep 30, 2015 Sep 30, 2016 Jun 30, 2016 NCUSIF Third Quarter 2016 Statistics 5 Yield Comparisons September 30, 2016 NCUSIF Third Quarter 2016 Statistics 6 3
11/17/2016 NCUSIF Portfolio September 30, 2016 NCUSIF Third Quarter 2016 Statistics 7 NCUSIF Equity Ratio FY 11 ‐ FY 16 NCUSIF Third Quarter 2016 Statistics 8 4
11/17/2016 Number of Problem Credit Unions CAMEL Code 4/5 FY 11 ‐ FY 16 NCUSIF Third Quarter 2016 Statistics 9 Percent of CAMEL Code 4/5 Shares to Total Insured Shares FY 11 ‐ FY 16 NCUSIF Third Quarter 2016 Statistics 10 5
11/17/2016 CAMEL Code 4/5 Comparison June 30, 2016 to September 30, 2016 Total Shares in Billions NCUSIF Third Quarter 2016 Statistics 11 Number of CAMEL Code 3 FY 11 ‐ FY 16 NCUSIF Third Quarter 2016 Statistics 12 6
11/17/2016 Percent of CAMEL Code 3 Shares to Total Insured Shares FY 11 ‐ FY 16 NCUSIF Third Quarter 2016 Statistics 13 CAMEL Code 3 Comparison June 30, 2016 to September 30, 2016 Total Shares in Billions NCUSIF Third Quarter 2016 Statistics 14 7
11/17/2016 Distribution of Assets in CAMEL Codes FY 11 ‐ FY 16 NCUSIF Third Quarter 2016 Statistics 15 Number of Credit Union Failures FY 11 ‐ FY 16 NCUSIF Third Quarter 2016 Statistics 16 8
11/17/2016 Office Contact Page Feel free to contact our office with questions or comments. Primary Staff: Rendell L. Jones Chief Financial Officer E ‐ mail Address: ncusif@ncua.gov Office Phone: (703) 518 ‐ 6570 NCUSIF Third Quarter 2016 Statistics 17 9
Recommend
More recommend