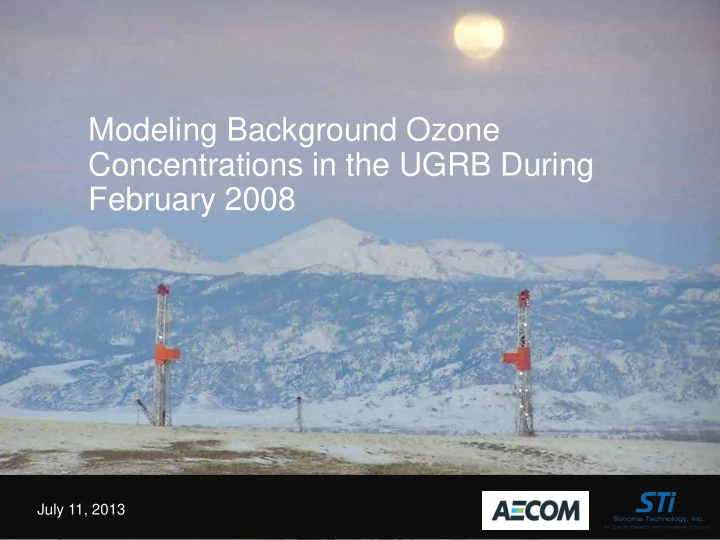

Modeling Background Ozone Concentrations in the UGRB During February 2008 July 11, 2013
Outline • Overview of Boundary Conditions • QA and Sensitivity Tests • Results • Conclusions 2
Boundary Conditions (BCs) Overview • Extracted from the global northern boundary GEOS-Chem model for this project western boundary • Defined at four lateral boundaries eastern boundary • Zero gradient at top • Provides continuous inflow of background concentrations into the 36- km domain southern boundary 3
Example of BC Transport on 36-km Domain (CMAQ) 4
Project Specifics • Needed ‘raw’ GEOS-Chem output to match WRF vertical layers • GEOS-Chem with dynamic tropopause was being run by EPA ORD – GEOS-Chem output for year 2008 provided by EPA ORD – Used EPA program to convert GEOS- Chem output to CMAQ-ready files – GEOS-Chem run still new, so extensive QA not conducted Illustration from http://celebrating200years.noaa.gov/breakthroughs/climate_model/modeling_schematic.html 5
Description of QA and BC Tests • QA model-ready BC files – Reasonable ozone profiles and concentration magnitudes – Confirm that both CMAQ and CAMx have similar BC ozone profiles • Conduct tests to assess amount of ozone transported to Sublette County – Run ozone in tracer mode for both models – Tracer mode means no sources, no chemistry, no deposition – transport only – Tagged ozone tracer both horizontally (north, south, east and west) and vertically 6
Possible Stratospheric Intrusion Events? 7
Vertical Binning (note vertical scale) L6 (32-36) 10.5 km L5 (29-31) 7.5 km L4 (26-28) 5 km L3 (20-25) 2 km L2 (16-19) 1 km L1 (1-15) 8
Comparison of Obs to PGM Tracers at 36-km Note: 1) stabilization period for is ~ 7 days 2) both PGM models track well at 36-km 9
Comparison of Obs to PGM Tracers at 36-km 10
Comparison of Obs to PGM Tracers at 36-km 11
Differences in Transport on 36-km Domain 12
Inter-Domain Comparison of CMAQ Ozone Tracers 13
Inter-Domain Comparison of CAMx BCs at Boulder – by Boundary 36-km Domain 1.33-km Domain Note: O3W means ozone from the western boundary, etc. 14
Diagnoses of 1.33 km Concentrations at Boulder – by Level Note: L1 means level 1, etc. as defined on slide 3 15
Diagnoses of 1.33 km Concentrations at Boulder – by Level Note: L1 means level 1, etc. as defined on slide 3 16
Diagnoses of 1.33 km Concentrations at Boulder – by Level Note: O3W03 means western boundary, level 3, etc. 17
Findings from the BC Tests • Both models produce similar ozone values in Sublette County (magnitude and timing) • Ozone tracer values seem consistent with the order of magnitude of the observations • Consistency among all domains • BC concentrations tend to come from western and northern boundaries • BC concentrations tend to come from levels 2 and 3 (i.e., vertical layers 16 – 25) with nominal heights above ground of ~1000 m to ~5000 m – No evidence of stratospheric intrusion affects 18
Recommend
More recommend