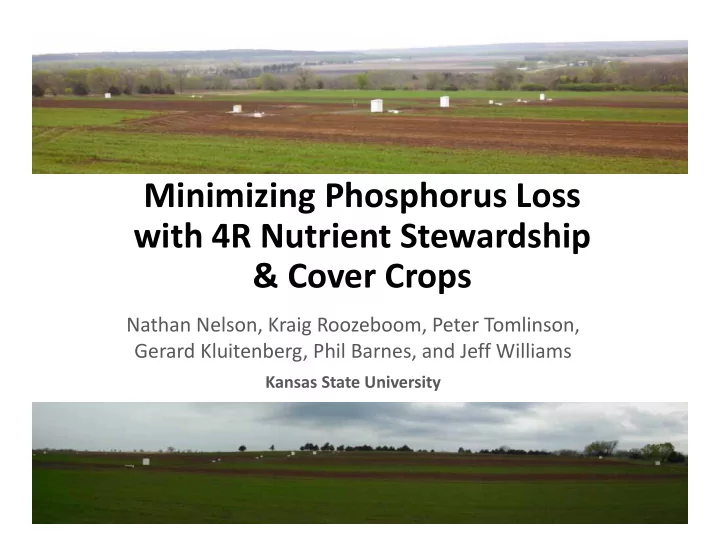

Minimizing Phosphorus Loss with 4R Nutrient Stewardship & Cover Crops Nathan Nelson, Kraig Roozeboom, Peter Tomlinson, Gerard Kluitenberg, Phil Barnes, and Jeff Williams Kansas State University
Maximizing returns and minimizing externalities
Phosphorus loss from agriculture can degrade water quality by promoting algal blooms. Centralia Lake, KS. Photo courtesy Kevin Price, 2012
What is the right “place” for P?
Best management practices to reduce P loss Reduce Erosion (no ‐ till)
Best Management Practices to Reduce P Loss Sub ‐ surface application of P P loss from Grain Sorghum in 1998 (Kimmell et al., 2001)
Tillage effects on runoff Increased runoff from no ‐ till can confound effects of reduced erosion 4 ‐ yr average annual runoff in sorghum ‐ soybean cropping systems (Zeimen et al., 2006)
Precipitation Trends for North ‐ east Kansas 30 ‐ yr average monthly precipitation at Manhattan, KS
Can Cover crops reduce P loss?
Research Questions (Objectives) How does P loss from fall surface ‐ applied fertilizer compare to spring injected P fertilizer (current recommended BMP)? • How does this impact crop production, nutrient use efficiency, and profitability? Will cover crops reduce P losses? • What are the agronomic, environmental, and economic effects of winter cover crops in corn ‐ soybean rotations? Will cover crops reduce P losses from fall surface ‐ applied fertilizer?
KAW Field Lab Kansas Agricultural Watersheds Field Lab
Constructed a new waterway
Re ‐ grade and rebuild terraces
Installed pipe outlets
Installed flumes
Installed flumes
Methods Small watershed/field ‐ scale study with natural rainfall No ‐ till corn ‐ soybean rotation (5 year duration) Factorial treatment structure • P fertilizer − 0 lbs P 2 O 5 /ac − 50 lbs P 2 O 5 /ac applied in 2x2 placement − 50 lbs P 2 O 5 /ac broadcast in fall • With or without winter cover crop
Field Measurements Grain Yield Water Loss (runoff) Sediment loss P loss • Dissolved • Total P N loss • NO 3 & NH 4 • Total N
Field Measurements Biomass production (crop and cover crop) • Nutrient content of biomass and grain Nutrient uptake (crop and cover crop) • Nutrient use efficiency – various computations • Environmental efficiency – (Nutrient loss/grain yield) Economic profitability
Precipitation corn planted cover crop planted P fertilizer broadcast through May 10
Runoff data from May 5, 2015 74.9 mm total precip. 31 to 41 mm total runoff
Runoff data from May 5, 2015 a 10% reduction b in total runoff p < 0.10
Total P concentration in runoff (5/5/15) p < 0.05
Total P load in runoff (5/5/15) p < 0.05
Summary Too early for any conclusions (preliminary or otherwise) Results are highly dependent on rainfall • Requires long ‐ term studies to determine trends Data collection will continue for 5 years
Acknowledgements Thanks to the following individuals for support David Abel (Graduate Student/RA) Undergraduate workers ‐ Gus Lamb, Egypt Edwards, Brett Bullinger and Tyler Royle Morgan Powell ‐ consulting Funding 4R Research Fund Kansas State Agricultural Experiment Station Kansas State Department of Agronomy Kansas Soybean Commission Kansas Corn Commission
Recommend
More recommend