Measurements and modeling of space charge assisted photoemission at - PowerPoint PPT Presentation
Measurements and modeling of space charge assisted photoemission at PITZ M.Krasilnikov for the PITZ team Experimental optimization of the PITZ photo injector for a nC bunch charge level resulted in machine parameters corresponding to a space
Measurements and modeling of space charge assisted photoemission at PITZ M.Krasilnikov for the PITZ team Experimental optimization of the PITZ photo injector for a nC bunch charge level resulted in machine parameters corresponding to a space charge assisted photo emission from the Cs 2 Te cathode. Several additional dedicated emission studies have been performed in order to study the charge production as a function of photo injector parameters like rf peak power in the gun, laser spot size at the cathode and laser pulse energy. Results of these studies will be discussed. Photocathode Physics for Photoinjectors (P3) Workshop - 2012
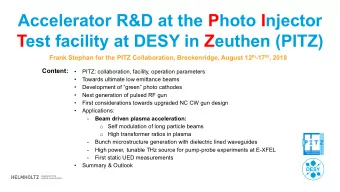
Photo Injector Test facility at DESY, Zeuthen site <7 MeV <25 MeV The Photo Injector Test facility at DESY in Zeuthen (PITZ) focuses on the development, test and optimization of high brightness electron sources for superconducting linac driven FELs: test-bed for FEL injectors: FLASH, the European XFEL small e tr stable production of short bunches with small s E further studies e.g. cathodes: dark current, photoemission, QE, thermal emittance, … + detailed comparison with simulations = benchmarking for the PI physics
PITZ RF gun and photo cathode laser Photo cathode Cathode laser (Cs 2 Te) 257nm Temporal pulse shaper QE~0.5-5% ~20ps (FWHM) Flattop OSS signal (UV) FWHM = 25 ps edge 10-90 edge 10-90 ~ 2 ps ~ 2.2 ps birefringent shaper, 13 crystals RFgun: L-band (1.3 GHz) nc (copper) standing wave 1½-cell cavity Peak rf power: up to 7MW Ez@cathode: > 60MV/m
Emission studies: motivation 1.5 1nC, charge (0.3mm, LT=62%) charge (0.3mm, LT=100%) meas.(0deg) 1.4 Ez at cathode, arb.units 1nC, simulated charge (XYrms=0.4mm, Qb=1nC) 1.3 xy-emittance (mm mrad) meas.(6deg) simulated charge (XYrms=0.3mm, Qb=1nC) 1nC, 1.6 1.2 measured mean momentum <Pz> simulated 6.79 1.1 1.4 1nC, simul. 6.77 (Ek=4eV) bunch charge (nC) 1.0 1.2 <Pz> (MeV/c) 6.75 0.9 1 6.73 0.8 0.8 0.7 6.71 0.6 0.6 6.69 0.4 0.5 6.67 0.2 0.20 0.25 0.30 0.35 0.40 0.45 0.50 0 6.65 rms laser spot size (mm) -60 -40 -20 0 20 40 60 80 100 gun phase-MMMG (deg) Cs 2 Te: R. A. Powel et. al. E G =3.3eV Photoemission Studies of Cesium Telluride. E A =E vac -E G =0.2eV Phys. Rev. B, 8: 3987 – 3995, 1973. E T =E G +E A =3.5eV E k =E ph -ET=4.05eV-E T =0.55eV ?Field enhancement?
Emission studies: modeling D.Dowell, J.Schmerge “ Quantum efficiency and thermal emittance of metal photocathodes”, PRST -AB 12, 074201 (2009) 2 𝑓𝛾𝐹 ℏ𝜕 − 𝜚 𝑓𝑔𝑔 1 − 𝑆(𝜕) , where the effective work function (Schottky term): 𝜚 𝑓𝑔𝑔 = 𝜚 𝑋 − 𝑓 𝑅𝐹 ≈ ∙ 1 + 𝜇 𝑝𝑞𝑢 (𝜕) 4𝜌𝜁 0 8𝜚 𝑓𝑔𝑔 𝐹 𝐺 + 𝜚 𝑋 𝜇 𝑓−𝑓 (𝜕) 2 𝑂 𝛿 1 − 𝑆(𝜕) 𝑓𝛾𝐹 𝑅 = ∙ ℏ𝜕 − 𝜚 𝑋 + 𝑓 The emitted charge: 1 + 𝜇 𝑝𝑞𝑢 (𝜕) 8𝜚 𝑓𝑔𝑔 𝐹 𝐺 + 𝜚 𝑋 4𝜌𝜁 0 𝜇 𝑓−𝑓 (𝜕) D.Dowell, PAC 2011 Tutorial Derivation of Schottky scan function: emitted charge vs. launch phase 2-parameter fit 𝑛 𝑅 ∝ 𝜃 ∙ 𝑀𝑈 ∙ 1 + 𝑐 𝐹 𝑀𝑈 = laser transmission (%) 𝐹 – field at the cathode (MV/m) 𝜃, 𝑐, 𝑛 – fitting parameters
Emission studies: modeling RF field influence (LT=25%) 𝑛 𝑀𝑈 = laser transmission (%) 𝑅 ∝ 𝜃 ∙ 𝑀𝑈 ∙ 1 + 𝑐 𝐹 𝐹 – field at the cathode (MV/m) 𝜃, 𝑐, 𝑛 – fitting parameters meas.(LT=25%,3.5MW) 𝑀𝑈 = 𝑀𝑈0 = 25% (1nC at MMMG phase for 6MW) 1.4 fitted (LT=25%,3.5MW) RF power (MW) Ecath (MV/m) max <Pz> (MeV/c) meas.(LT=25%,6MW) 1.2 fitted (LT=25%,6MW) bunch charge (nC) 6.02 62.0 6.83 1 3.54 47.6 5.43 0.8 0.6 Fitting: 0.4 Phase range: 10 70deg 𝐹 = 𝐹 𝑑𝑏𝑢ℎ ∙ 𝑡𝑗𝑜𝜒 0 0.2 h =1.2148E-5 b=10.9222 0 -20 0 20 40 60 80 100 120 140 m=1.8705 (1.8977-2.1081) 2 launch phase (deg) +convolution with lase laser temporal pr profile le Measurements: Laser: • Temporal flattop 2/20\2ps • Transverse 0.3 mm rms Main solenoid: 400A Charge measured by LOW.ICT1 z=0.9m
Emission studies: modeling RF field Simultaneous fitting (LT=13% and 25%): 𝑛 Phase range: 10 70deg 𝑅 ∝ 𝜃 ∙ 𝑀𝑈 ∙ 1 + 𝑐 𝐹 𝐹 = 𝐹 𝑑𝑏𝑢ℎ ∙ 𝑡𝑗𝑜𝜒 0 h =8.44E-8 b=205.9 m=1.805 LT=13% LT=25% LT=100% meas.(LT=100%,3.5MW) meas.(LT=25%,3.5MW) 2 2 2 fitted (LT=100%,3.5MW) fitted (LT=25%,3.5MW) 1.8 1.8 1.8 meas.(LT=100%,6MW) meas.(LT=13%,3.5MW) meas.(LT=25%,6MW) fitted (LT=100%,6MW) 1.6 1.6 1.6 fitted (LT=13%,3.5MW) fitted (LT=25%,6MW) bunch charge (nC) bunch charge (nC) bunch charge (nC) 1.4 1.4 1.4 meas.(LT=13%,6MW) fitted (LT=13%,6MW) 1.2 1.2 1.2 1 1 1 0.8 0.8 0.8 0.6 0.6 0.6 0.4 0.4 0.4 0.2 0.2 0.2 0 0 0 -20 0 20 40 60 80 100 120 140 -20 0 20 40 60 80 100 120 140 -20 0 20 40 60 80 100 120 140 launch phase (deg) launch phase (deg) launch phase (deg) • Simultaneous fitting assumptions are not correct? • Almost no RF impact for low SC density • RF field impact increases with SC density increase
Emission studies: LT scans and ASTRA simulations Measured cathode laser shapes 1.6 Charge vs. laser pulse energy 1.4 Temporal profile 1 laser intensity (arb.units) 1.2 bunch charge (nC) 0.8 1 0.8 0.6 measured(MMMG phase) OSS measurement 0.6 0.4 simulated (ideal transv. flattop) FT-fit (2.18/19.88\2.43ps) 0.4 0.2 simulated (+ transv.halo) SG-fit(2.34/19.74\2.34ps) 0.2 0 0 -12-10 -8 -6 -4 -2 0 2 4 6 8 10 12 0 0.5 1 1.5 2 2.5 3 3.5 4 4.5 5 t (ps) ~ laser energy (arb.units) 0.8 0.5 0.6 0.45 0.4 0.4 Transverse 0.35 0.2 y (mm) 0.3 0 halo modeling 0.25 -0.2 0.2 in ASTRA 0.15 -0.4 0.1 -0.6 0.05 -0.8 -0.8 -0.6 -0.4 -0.2 0 0.2 0.4 0.6 0.8 x (mm)
ASTRA simulations: Schottky effect implementation ASTRA: charge of a particle at the time of its emission: 2 𝑅 ∝ 𝜃 ∙ 𝑀𝑈 ∙ 1 + 𝑐 𝐹 𝑅 = 𝑅 0 + 𝑇 𝑇𝑑ℎ𝑝𝑢𝑢𝑙𝑧 ∙ 𝐹 + 𝑀 𝑇𝑑ℎ𝑝𝑢𝑢𝑙𝑧 ∙ 𝐹 𝑀𝑈 = 𝜊 ∙ 𝑀𝑈0 ASTRA input: 𝑅 𝑐𝑣𝑜𝑑ℎ = 𝜊 ∙ 𝑅 𝑐𝑣𝑜𝑑ℎ0 𝑅 𝑐𝑣𝑜𝑑ℎ , 𝑇 𝑇𝑑ℎ𝑝𝑢𝑢𝑙𝑧 2-parameter fitting 𝑇 𝑇𝑑ℎ𝑝𝑢𝑢𝑙𝑧 = 𝜊 ∙ 𝑇 𝑇𝑑ℎ𝑝𝑢𝑢𝑙𝑧0 2 𝑇 𝑇𝑑ℎ𝑝𝑢𝑢𝑙𝑧 𝑀 𝑇𝑑ℎ𝑝𝑢𝑢𝑙𝑧 = Schottky constants should be 𝑅 𝑐𝑣𝑜𝑑ℎ scaled with laser pulse energy No Schottky effect applied Schottky parameter fitting 2 2 measured measured 1.8 (LT=25%) 1.8 (LT=25%) 1.6 measured 1.6 measured bunch charge (nC) bunch charge (nC) (LT=100%) (LT=100%) 1.4 1.4 simul.(Qb=0.5nC, 1.2 simul.(Qb=1.2nC, 1.2 +Schottky) no Schottky) 1 1 simul.(Qb=2nC, simul.(Qb=4.8nC, 0.8 0.8 +Schottky) no Schottky) 0.6 0.6 0.4 0.4 0.2 0.2 0 0 -60 -40 -20 0 20 40 60 80 100 -60 -40 -20 0 20 40 60 80 100 launch phase-MMMG (deg) launch phase-MMMG (deg) Qbunch= 0.5nC 𝜊 = 100% 25% = 4 L_Schottky= 0.0059983 S_Schottky= 0.109529
ASTRA simulations: Schottky effect impact 1.4 Bunch current profile after measured (LT=25%) emission (z=0.1m) 1.2 60 simul.(Qb=0.5nC, +Schottky) Qbunch=1.2nC, no Schottky 1 bunch charge (nC) 50 simul.(Qb=1.2nC, Qbunch=0.5nC, +Schottky beam current (A) no Schottky) 0.8 40 0.6 30 0.4 20 0.2 10 0 0 -60 -40 -20 0 20 40 60 80 100 -5 -4 -3 -2 -1 0 1 2 3 4 5 launch phase-MMMG (deg) z-<z> (mm) Applied Schottky effect more smooth charge extraction
Further emission studies: + laser spot size and pulse energy variation Q(6.1nJ;6MW;1.2mm) Q(1.4nJ;6MW;1.2mm) 2000 Q(0.7nJ;6MW;1.2mm) 2000 2000 Q(6.1nJ;3.5MW;1.6mm) Q(1.4nJ;3.5MW;1.6mm) 1800 1800 1800 Q(0.7nJ;3.5MW;1.6mm) 1600 1600 1600 1400 1400 1400 Bunch charge, pC Bunch charge, pC Bunch charge, pC 1200 1200 1200 1000 1000 1000 800 800 800 600 600 600 400 400 400 200 200 200 0 0 0 -20 0 20 40 60 80 100120140 -20 0 20 40 60 80 100120140 -20 0 20 40 60 80 100120140 gun (ASTRA) phase, deg gun (ASTRA) phase, deg gun (ASTRA) phase, deg 𝑄 𝑠𝑔 ∙ 𝑀𝑏𝑡𝑓𝑠𝑇𝑞𝑝𝑢𝐸𝑗𝑏𝑛𝑓𝑢𝑓𝑠 = 6 ∙ 1.2 = 3.5 ∙ 1.6 = 3 = 𝑗𝑜𝑤? 𝑚 ∙ 𝜏 𝑧 𝑚 = 𝑗𝑜𝑤 ? 𝐹 catℎ ∙ 𝜏 𝑦
Recommend


More recommend
Explore More Topics
Stay informed with curated content and fresh updates.