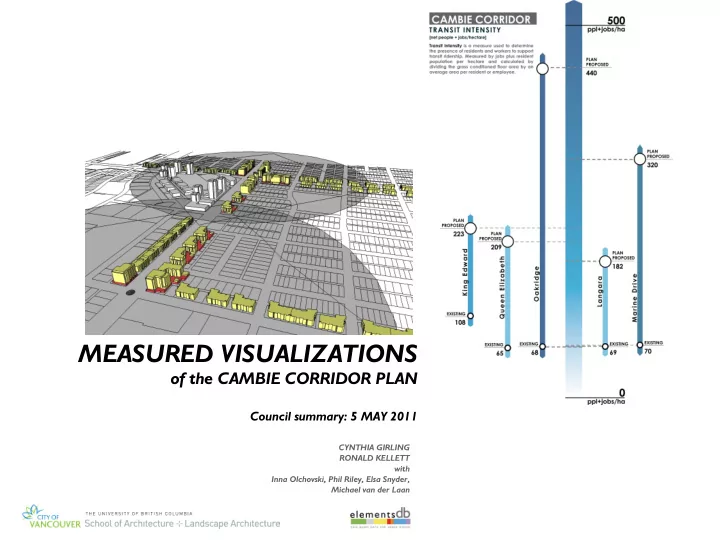

MEASURED VISUALIZATIONS of the CAMBIE CORRIDOR PLAN Council summary: 5 MAY 2011 CYNTHIA GIRLING RONALD KELLETT with Inna Olchovski, Phil Riley, Elsa Snyder, Michael van der Laan
We create tools and methods to inform urban planning processes
Cities . . . are (mostly)built from familiar, replicable, measurable components that can be translated as . . . words images + numbers + 4 storey 2.33 far highrise midrise 250 uph lowrise 65 people / 35 jobs 90 %impervious attached detached 2.13 GWh/ha mixed use “Tribeca” at 11th and Arbutus which can be . . .
. . . aggregated parcels To simulate the appearance of planning and design alternatives blocks neighbourhoods and . . .
. . . measured To generate evidence of performance
Cambie Corridor: contemplated land use/building heights City of Vancouver Planning, May 2010 1.How much land use intensification ? KEY QUESTIONS 2.How distributed ? 3.How supportive of transit ? 4.How supportive of community energy ?
Case-based modeling Oakridge - Langara, for example Equivalent Vancouver cases May 2010 sketch
measuring . . . ON CORRIDOR areas All corridor study areas Case-based new buildings + Census + BCAA UNIQUE areas OFF CORRIDOR areas Census + BCAA Census + BCAA + project proposals EXCEPTIONS Large ‘to be developed’ parcels not included
measuring . . . Oakridge-Langara, for example 1 On-corridor areas Unique areas 2 MIXED USE CASES OAKRIDGE Mall + data Oakridge Policy Document RESIDENTIAL CASES 3 Off-corridor areas WITHIN 500m 3 dwellings per parcel average
reporting results . . . Built 3-d model of the corridor from 16th to Marine Drive Calculated land use intensification, population and job change and thermal energy intensity for by study area each block Proposed condition Aggregated block results by ‘study area’ and in pictures and numbers ‘whole corridor’ Reference points or benchmarks Relative change to study area Existing condition in pictures and numbers
by whole corridor . . . by study area . . . Whole corridor reference scale Proposed condition in pictures and numbers Reference points or benchmarks Relative change to study area Existing condition in pictures and numbers
1.How much land use intensification ? 2.How distributed ?
All study areas more than doubled Dwelling intensity dwelling density measures residential land use intensity in net units Most roughly equal to Joyce-Collingwood per hectare(estimated number of dwelling units divided by land area exclusive of street rights of way) Oakridge intensifies the most (7.3x) King Edward and Marine Drive ** intensify the least (<2.5x) ~ Joyce - Collingwood *Langara excludes significant pending off- corridor development ** Marine Drive study area includes significant non-residential land uses
All study areas more than doubled floor Floor space intensity area intensity (FAR) measures development intensity in average FAR Marine Drive intensifies the most (9.3x) (estimated conditioned floor area divided by parcel area — only on corridor parcels) King Edward intensifies the least (2.3x)
3. How supportive of transit ? KEY FACTORS: Density (ridership potential) Distance (pedestrian accessibility) Diversity (destination / origin balance) Design (vitality, livability)
Transit intensity All study areas achieve neighbourhood TOD threshold within 500m measures the number of residents and jobs (estimated population and jobs within 500m of Cambie) Greatest concentration and closest jobs / housing balance at key nodes — Oakridge and Marine Drive ~ 250 p+j/ha mid-range threshold urban TOD ~ 150 p+j/ha lower range threshold at ~30% mode split neighbourhood TOD
4. How supportive of community energy ? KEY FACTORS: Land use intensity (load potential) Land use diversity (load balance) Proximity (distribution efficacy) Building type and scale (connection efficacy)
Thermal energy intensity was benchmarked against local examples actual feasibility requires site-specific analysis SEFC ~3.00 GWh/ha/year Dockside Green ~1.75 GWh/ha/year
Thermal energy intensity measures heat energy density (space heating and hot water per hectare) SEFC — an indicator of community energy system potential ~3.00 GWh/ha/year Langara study area achieves thermal energy density of SEFC All study areas achieve thermal energy density of Dockside Green Dockside Green ~1.75 GWh/ha/year
MEASURED VISUALIZATIONS of the CAMBIE CORRIDOR PLAN Council summary: 5 MAY 2011 CYNTHIA GIRLING RONALD KELLETT with Inna Olchovski, Phil Riley, Elsa Snyder, Michael van der Laan
Recommend
More recommend