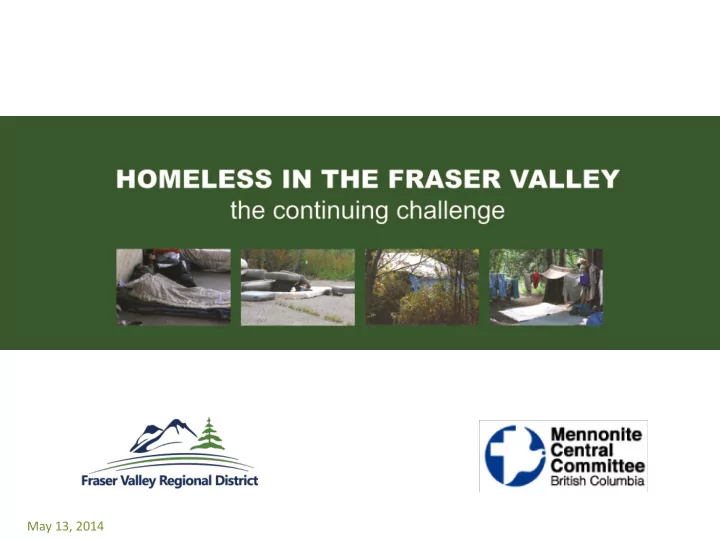

May 13, 2014
Addressing Homelessness Issues in the FVRD Homelessness is not just a Metro Vancouver issue. • The FVRD has been involved in addressing affordable housing and homelessness in the region through research, data and several housing forums. • The FVRD has contributed funding to the last three homelessness counts. • FVRD’s collaboration with the Mennonite Central Committee (MCC) has produced research, reports and inventories that have supported affordable housing and homelessness initiatives throughout the Region.
2014 FVRD Homelessness Count • Purpose was to determine whether homelessness is increasing or decreasing in the Region. • Teams of volunteers conducted a formal count of homeless people in the FVRD on March 11 and 12. • Survey coordinated with similar process taking place at the same time in the Metro Vancouver region • Is a "snapshot" of homelessness throughout the Fraser Valley, from Boston Bar to Abbotsford, and west through the Lower Mainland to Bowen Island. • A similar survey in 2011 found 345 people in Fraser Valley living homeless.
2014 FVRD Homelessness Count Abbotsford • The count could not have been accomplished without community partners and volunteers. • Partners – Funding: Fraser Valley Regional District – Abbotsford Community partners: The 5 and 2 Ministries; The Salvation Army; Abbotsford Community Services (Foodbank); Cyrus Centre; Women's Resource Society of the Fraser Valley; and United Way • Approximately 20 individual volunteers also aided in the count.
2014 FVRD Homelessness Count Preliminary Totals FVRD Homeless Count Number surveyed 2004 to 2014 • Total number of homeless persons in Region remained flat from 2011in the FVRD. Total FVRD Change 465 • In Abbotsford, the 2014 total is 413 still well below the high of 235 345 346 homeless people counted in 2008. • Abbotsford has seen the greatest increase within the FVRD since 2004 2008 2011 2014 2011 (29%).
2014 Abbotsford Homelessness Count Preliminary Totals 2014 - Previous Community • OUT OF Consistent with 2011 count COUNTRY the majority of homeless 1% persons (70%) have come to the FVRD from elsewhere. OUT PROVINCE FVRD 24% 30% BC-OTHER Metro 20% Vancouver 25%
2014 Abbotsford Homelessness Count Preliminary Totals • Nearly 40% of homeless Length of Residency in Current City individuals in Abbotsford have lived here for over 10 10+ YEARS 38.4% years. 5-10 YEARS 8.6% 2-5 YEARS 8.6% • Only 1 in 10 people who are 1-2 YEARS 4.0% homeless in Abbotsford 6-12 MONTHS 4.6% have lived here for less than 0-6 MONTHS 9.9% 6 months
2014 Abbotsford Homelessness Count Preliminary Totals Age Distribution • Disproportionate numbers of homeless persons are in 28% 27% the 15-19, 30-39, and 40-49, General Population age cohorts. Homeless Population 15% 14% 14% • Youth homelessness, for 12% 12% 12% 11% 11% those between the ages of 10% 7% 15-19, is a continuing 7% concern. 2% 15-19 20-29 30-39 40-49 50-59 60-69 70+
2014 Abbotsford Homelessness Count Preliminary Totals 2014 Gender 60% • More men than women are homeless. 34% • The general population has 50- 50 gender split. 6% MALE FEMALE UNKNOWN • Most people are living 2014 Sheltered/Unsheltered unsheltered. 75% • Sheltered: emergency shelter (youth and general) & 25% transition house • Unsheltered: outside, car/camper and couch surfing SHELTERED UNSHELTERED
2014 Abbotsford Homelessness Count Preliminary Totals 2014 Source of Income • A significant proportion of Welfare 36.3% Binning/Bottling 16.8% homeless persons are on Disability Benefit 15.9% welfare. No Income 11.7% Family/Friends 9.7% • Panhandling 7.1% Just under 12% report no Employment PT 7.1% income and 9.7% rely on family CPP 3.5% and friends for assistance. Employment FT 0.9% EI 0.9% Other 21.2% 2014 State of Health • Of those with health issues, Addiction many reported having multiple 51.7% Mental Illness 27.8% conditions. Physical Disability 19.9% Medical Condition 25.8%
2014 Abbotsford Homelessness Count Preliminary Totals What one thing would help end • Majority of homeless Homelessness for you? persons view the lack of affordable housing as a barrier to becoming AFFORDABLE HOUSING 42.2% permanently housed. INCOME 32.0% OVERCOMING ADDICTION 6.2% SUPPORT/ADVOCAY 5.2% EMPLOYMENT 5.2% OTHER 9.2%
2014 FVRD Homelessness Count Next Steps • More detailed analysis of survey data • Full Report later this year • Review/identify funding gaps and opportunities • Separate Project: Social Housing Inventory update – updating 2009 inventories for each community.
Recommend
More recommend