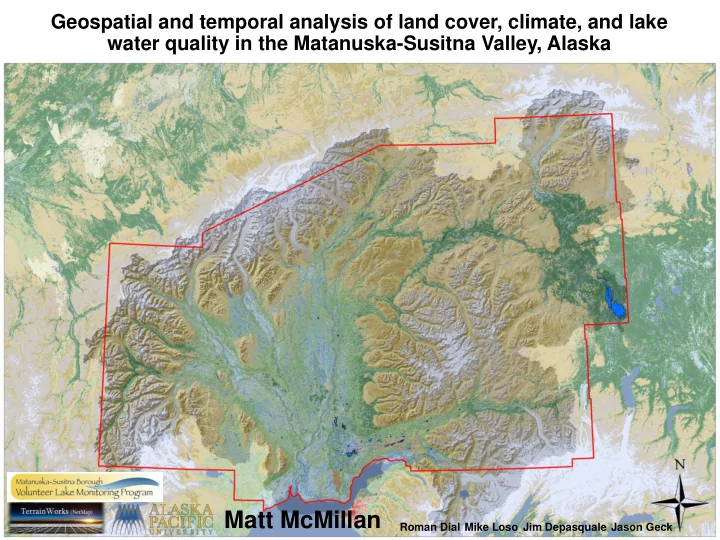

Geospatial and temporal analysis of land cover, climate, and lake water quality in the Matanuska-Susitna Valley, Alaska Matt McMillan Roman Dial Mike Loso Jim Depasquale Jason Geck
Buildings Built
• Chlorophyll-a ( μ g L ¯¹) • Total Phosphorus ( μ g L ¯¹) • Temperature ( ° C) • pH (standard units) • Dissolved Oxygen (mg L ¯¹) • Specific Conductivity ( μ S cm ¯¹)
Comparing Lakes and Water Quality Subset of 17 lakes – 6 median water quality parameters sc – Specific Conductivity chl – Chlorophyll-a tp – Total Phosphorus pH – pH do – Dissolved Oxygen temp – Temperature Non-metric Multidimensional Scaling • Lakes closer together are more similar • Lakes that are farther apart are more dissimilar
Average Annual Trends Chlorophyll-a pH Total Specific Conductivity Phosphorus Dissolved Temperature Oxygen
Specific Conductivity-Landscape Relationships Environmental variables evaluated for correlation with in-lake specific conductivity: • Land cover • wetland type/wetland area • watershed area • watershed:lake ratio • 100-m buffer area • buffer:lake ratio Significant Correlations • mean annual air temperature • total annual precipitation • Developed land cover • septic tanks • Scrub/Shrub land cover • buildings • Barren land cover • road density • Septic tanks • perimeter • Buildings • maximum depth • Watershed slope • • shoreline irregularity Watershed area • surface area
Modeling Specific Conductivity-Landscape Relationships Multiple regression evaluated with ΔAIC Specific conductivity = Watershed slope + Septic tanks r 2 = 0.71 Juke’s Finger ) Log ( Log ( )
Specific Conductivity Trends Environmental variables evaluated for correlation with in-lake specific conductivity trends: • Land cover change 2001-2011, • Change in average mean air temperature from normal 2001- 2011 • change in average total precipitation from normal 2001- Significant Correlations 2011 • watershed area • Lake maximum depth • • 100-m buffer area Buildings built • Forest cover – Developed cover • Buildings built • • Mean Annual Air Temp road density • Air Temperature Change • Perimeter • Total Annual Precipitation • maximum depth • Precipitation Change • shoreline irregularity • surface area
Modeling Specific Conductivity Trends Multiple regression evaluated with ΔAIC SC trend = Development - Max depth + Δ Temp + Δ Precip Lucill r 2 = 0.84 e Juke’ s LQ
Take Home • Lake water quality depends on hydrology - Discharge, Seepage • Overall very few statistically significant trends • Most of the trends were increases in Specific Conductivity • Specific conductivity depends on: • the steepness of the watershed • development within the watershed. • Trends in Specific Conductivity depended on: • New development • Increased Precipitation • Increased Temperatures • Lake depth • Important for modeling the effects on water quality in land use and climate change scenarios
Work in progress/planned • Stable isotopes of oxygen and hydrogen • Particulate organic matter (POM) • Holocene climate reconstruction using lake sediment cores from small marl (calcium carbonate) lake Future Lake Research Needed • Chemical analysis of dissolved ions in lakes • Fecal coliform sampling • Sediment coring • Lake bathymetry • Effects from wildfires on water quality • Classification of land cover using high resolution imagery Thank You • Melanie Trost • Laura Gooch • Frankie Barker
Recommend
More recommend