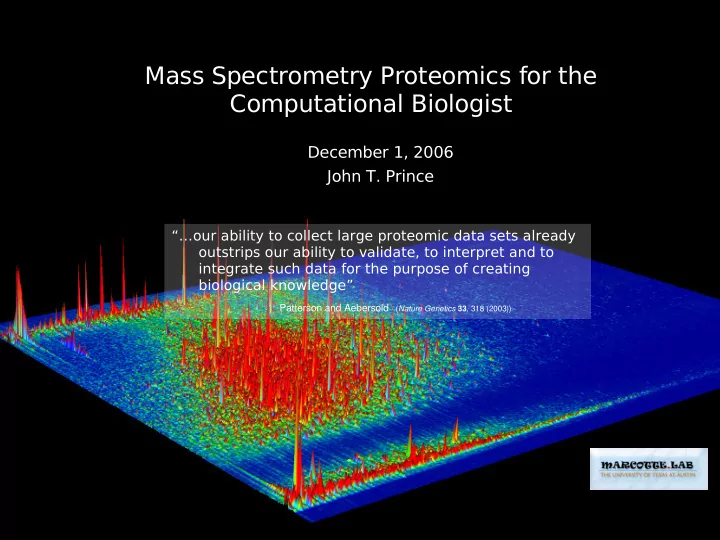

Mass Spectrometry Proteomics for the Computational Biologist December 1, 2006 John T. Prince “…our ability to collect large proteomic data sets already outstrips our ability to validate, to interpret and to integrate such data for the purpose of creating biological knowledge” Patterson and Aebersold ( Nature Genetics 33 , 318 (2003))
Mass Spectrometry (MS) Proteomics Needs Computational Biologists “…our ability to collect large proteomic data sets already outstrips our ability to validate, to interpret and to integrate such data for the purpose of creating biological knowledge” Patterson and Aebersold ( Nature Genetics 33 , 318 (2003))
MS Proteomics How? Data? Problems?
Why Proteomics? and not just Transcriptomics Proteins are the actual players mRNA not necessarily proportional to protein level translational control degradation Post-translational modifications alter cell state Cellular localization
Mass Spec (Proteomics) Ionization MALDI ESI m/z Analysis TOF Quadrupole Ion Trap FTICR Orbitrap
MALDI Matrix Assisted Laser Desorption Ionization http://www.eurogentec.com/module/images2/p23_3.jpg
ESI Electrospray Ionization http://www.phoenix-st.com/images/splash2.jpg
TOF Time of Flight detector vacuum TOF (reflectron) high velocity low velocity detector vacuum
Q (e.g., Q-TOF, QQQ)Quadrupole http://www.bris.ac.uk/nerclsmsf/images/quadrupole.gif QQQ http://www.rzuser.uni-heidelberg.de/~bl5/ency/pics/t_tsq1.jpg
Quadrupole Ion Trap http://www.rzuser.uni-heidelberg.de/~bl5/ency/pics/q_trap01.jpg K. Yoshinari, Rapid Commun. Mass Spectrom. 14, 215-223 (2000)
FT-ICR Fourier Transform Ion Cyclotron Resonance http://www.ivv.fraunhofer.de/ms/ms-analyzers.html
FT-Orbi Orbitrap (from Linear Ion Trap via C trap) http://www.spectroscopynow.com/ftp_images/orbitrap_0505.jpg
Mass Spectrometry (Proteomics) Ionization ESI (Electrospray Ionization) MALDI (Matrix Assisted Laser Desorption Ionization) m/z Analysis TOF (Time of Flight) Q ([e.g. Q-TOF] Quadrupole) Ion Trap FTICR (Fourier Transform Ion Cyclotron Resonance) Orbitrap
Data Spectrum ESI Protein Spectrum 2D MALDI imaging PMF (peptide mass fingerprinting) LC-MS Peptide Fragmentation MudPIT
Spectrum M2H++ MH+ MH+ ion count (peak heights are the number of ions that hit the detector at the given m/z) m/z
Why Not Proteins? PTMs (Post-Translational Modifications) Multiple Charge States (ESI) http://www-methods.ch.cam.ac.uk/siteimages/sw3.jpg http://www.nature.com/nbt/journal/v21/n3/images/nbt0303-255-T1.gif
MALDI on Biological Sample – Signal Processing – Classification Analysis http://www.mcb.mcgill.ca/~hallett/GEP/PLecture4/image002.gif
MALDI-TOF Application http://www.mc.vanderbilt.edu/msrc/images/maldi_ms_principle.jpg – organize data – integrate data – mine data
PMF Peptide Mass Fingerprinting – statistical validation http://www.spectroscopynow.com/ftp_images/2Fig3.gif
LC-MS Liquid Chromatography MS ESI Reverse Phase Chromatography (RPC) MS – elution prediction – registration http://www.ionsource.com/tutorial/chromatography/rphplc10.gif t i m e ( h y d r o m/z p h o b i c i t y )
MS/MS (Peptide Fragmentation) http://www.mcb.mcgill.ca/~hallett/GEP/PLecture5/PLecture5.html
Peptide Fragmentation (MS/MS) y3 y2 y1 AFTG peptide b1 b2 b2 break Thr Gly Phe Ala intensity (ion count) 57.02 71.03 101.04 147.06 b1 AFTG (MH+) b2 b3 m/z diagram adopted from Mayo Clin Proc. 2002;77:1185-1196
Shotgun Proteomics quantitation peptide fragmentation prediction spectra comparison metrics peptides to proteins integrating bayesian priors
MuDPIT Multidimensional Protein Identification Technology SCX (Strong Cation Exchange) RP (Reverse Phase-C18) ESI Ion Trap – multi-dimensional dataset registration
PTM's Post-translational Modifications http://www.nature.com/nbt/journal/v21/n3/images/nbt0303-255-T1.gif
Spectra In Metric-Space 2300 points (at random) in 3D space
Data Format/Storage/Sharing Object Models still being worked out Huge Datasets how much to save? how much is it worth? Sharing OPD Peptide Atlas PRIDE GPM
Biological Integration
mRNA vs. Protein Perturbation Perturbation Num Num Source Source Subject Subject Correlation Correlation Genes Genes (or sample) (or sample) +/- gal +/- gal Ideker et. al. Ideker et. al. Yeast Yeast 289 289 r p = 0.61 r p = 0.61 (gal inducing (gal inducing media) media) 2% ethanol/ 2% ethanol/ r s = 0.74 r s = 0.74 Futcher et. al. Futcher et. al. Yeast Yeast 148 148 r p = 0.76 a r p = 0.76 a 2% glucose 2% glucose Washburn et. Washburn et. Yeast Yeast rich/minimal rich/minimal 678 678 r s = 0.45 r s = 0.45 al. al. 2% ethanol/ 2% ethanol/ Griffin et. al. Griffin et. al. Yeast Yeast 245 245 r s = 0.21 r s = 0.21 2% galactose 2% galactose r p = 0.94 r p = 0.94 r s = 0.59 b r s = 0.59 b Gygi et. al. Gygi et. al. Yeast Yeast mid-log mid-log 106 106 r p = 0.356 c r p = 0.356 c 57 stage I, 57 stage I, 98 98 Lung Lung r p = -0.025 d r p = -0.025 d Chen et. al. Chen et. al. 19 stage III, 19 stage III, adenocarcinomas adenocarcinomas (165 prots) (165 prots) 9 non-neoplastic 9 non-neoplastic a = after normalizing the data b = calculated by Futcher et. al. c = 73 genes with lower abundance transcripts d = after detailed statistical analysis
Disulfide Bonds Expected fraction: 1 - (1-freq)^n [Rolling one “6” in n rolls is 1 – (5/6)^n] Using RasMol amino acid color scheme
180 220 256 292 320 328 Capillary Temperature (deg C)
Acknowledgments Dr. Edward Marcotte Dr. Klaus Linse Dr. Maria Person Dr. Aleksey Nakorshevskiy Dr. Rong Wang Dr. Peng Lu Zhihua Li
Recommend
More recommend