Logical modelling of cellular decisions Denis Thieffry - - PowerPoint PPT Presentation

logical modelling of cellular decisions
SMART_READER_LITE
LIVE PREVIEW

Logical modelling of cellular decisions Denis Thieffry - - PowerPoint PPT Presentation

Logical modelling of cellular decisions Denis Thieffry (thieffry@ens.fr) Contents Introduction Logical modelling T-helper cell differentiation MAPK network Porquerolles, June 25th, 2013 Cell proliferation, differentiation or


slide-1
SLIDE 1

Logical modelling of cellular decisions

Contents

  • Introduction
  • Logical modelling
  • T-helper cell differentiation
  • MAPK network

Porquerolles, June 25th, 2013

Denis Thieffry (thieffry@ens.fr)

slide-2
SLIDE 2

Cell proliferation, differentiation

  • r death...

How are decisions taken?

slide-3
SLIDE 3

Key biological questions

=> Investigations using dynamical modelling

  • How does a cell decide which differentiation pathway

to follow?

  • When and to what extend cells become committed?
  • To what extend and how is it possible to force cell to change

their differentiation states?

slide-4
SLIDE 4

Dynamical modelling

Why ?

  • To gain rigourous, global, functional understanding of the

(complex) underlying networks

  • To predict the behaviour of the system in novel situations
  • To design novel experiments

How ?

  • Regulatory charts/maps/graphs (CellDesigner, Cytoscape)
  • Qualitative modelling: Boolean / multilevel discrete

networks

  • Quantitative modelling: ODE, PDE, Stochastic equations
slide-5
SLIDE 5

Boolean networks - Stuart Kauffman (1969)

The Boolean vector x represents the state of the system Random connections, nodes with predefined degree Canalizing Boolean functions Focus on asymptotic behaviour Two types of attractors: stable states and (simple) cycles Deterministic behaviour (only one possible following state)

xt +1 = B(xt )

slide-6
SLIDE 6

Kinetic logic - René Thomas (1973)

Xi (image or logical function) specifies whether gene i is currently transcribed xi (logical variable) denotes the presence (above a threshold of the functional product of gene i

X = B(x)

t Xi

Gene i switched ON Gene i switched OFF 1

xi

1 Delay dOFF Delay dON

slide-7
SLIDE 7

Logical modelling of regulatory networks

 A graph describes the interactions between genes or regulatory products Logical rules/parameters

KA = 2 IFF (C=0) KA = 0 otherwise

 Discrete levels of expression associated to each regulatory component and interaction

KC = 1 IFF (B=1) AND (C=0) KC = 0 otherwise B C C

1

C

Decision trees

2

C C=0 1 KB = 1 IFF (A=1) KB = 0 otherwise

1

A 2 1

[1] [2]

B C A

slide-8
SLIDE 8

Logical modelling of regulatory networks

 A graph describes the interactions between genes or regulatory products Logical rules/parameters

2

C

 Discrete levels of expression associated to each regulatory component and interaction

B C

1 1

A

Decision diagrams

KA = 2 IFF (C=0) KA = 0 otherwise KB = 1 IFF (A=1) KB = 0 otherwise KC = 1 IFF (B=1) AND (C=0) KC = 0 otherwise C=0 1 2 1

[1] [2]

B C A

slide-9
SLIDE 9

Logical state transition graphs

Asynchronous updating (R Thomas)

ABC C↑ C↓ B↓ B↓ A↑

Regulatory graph + Logical rules => simulations / dynamical analysis State transition graph

Stable state

[1] [2]

B C A

slide-10
SLIDE 10

Logical state transition graphs

ABC

Stable state

+ Logical rules

Cycle Cycle

B↓ C↓ C↓

State transition graph Synchronous updating (S Kauffman)

A↑ C↑ A↑

[1] [2]

B C A

slide-11
SLIDE 11

Logical state transition graphs

ABC

Stable state

+ Logical rules State transition graph

B↓ C↓

Mixed a/synchronous updating: 2 priority classes: (1) synchronous fast decays (2) synchronous slow syntheses

B↓ B↓

Fauré et al (2006) Bioinformatics 22: e124-31

A↑ B↑ A↑ A↑ C↑

[1] [2]

B C A

slide-12
SLIDE 12

GINsim (Gene Interaction Networks simulation)

analysis toolbox core simulator GINML parser user interface

graph analysis graph editor simulation

State transition graph

Regulatory graph

Aurélien NALDI Fabrice LOPEZ Duncan BERENGIER Claudine CHAOUIYA

Naldi et al (2009) BioSystems 97: 134-9 Chaouiya et al (2013) Meth Mol Biol 804: 463-79 Available at http://ginsim.org

slide-13
SLIDE 13

Development of dynamical analysis tools

  • Decision diagrams
  • Identification of attractors
  • State transition graph compression
  • Analysis of regulatory circuits
  • Model reduction
  • Priority classes
  • Mixed a/synchronous simulations
  • Petri nets
  • Standard Petri nets
  • Coloured Petri nets
  • Model checking
  • Verification of dynamical properties (temporal logic)
  • Logical programming
  • Attractor identification and reachability analysis
slide-14
SLIDE 14

Efficient identification of stable states

A

B C 1

A

KC =1 IFF !A

1

A C

KB =1 IFF A & !C KA= 1 IFF A

1

A

=> 2 stable states : 001 et 110

slide-15
SLIDE 15

=> 2 stable states : 001 et 110

Efficient identification of stable states

A

B C 1

A C C

KC

1 1

A B B C C

stable unstable

KB

*

1

A C B B C

Stability condition

*

Naldi, Chaouiya & Thieffry (2007) LNCS 4695: 233-47.

KA

1 1

A

stable

slide-16
SLIDE 16

Coping with the exponential growth

  • f logical state transition graphs
  • Attractor identification
  • Compaction of state transition graphs
  • Model reduction
  • Temporisation (e.g. priorities, delays, etc.)
  • Model checking
slide-17
SLIDE 17

2 3 3 2 1 1 2 2

Thieffry & Thomas (1995)

Bacteriophage lambda: regulatory graph

slide-18
SLIDE 18

Node => target value Logical Rule CI => 2 CI => 0 !Cro | CII Otherwise Cro => 3 Cro => 2 Cro => 0 !CI & !Cro !CI & Cro CI CII => 1 CII => 0 !CI & !Cro & N Otherwise N => 1 N => 0 !CI & !Cro Otherwise

Thieffry & Thomas (1995)

Phage lambda model : logical rules

slide-19
SLIDE 19

[CI, Cro, CII, N]

Lambda phage model: state transition graph (STG)

Lysogeny (only CI expressed)

slide-20
SLIDE 20

Lambda phage model: state transition graph (STG) coloration according to strongly connected components

lysogeny

  • nly CI expressed

cyclic attractor for lysis

  • nly CRO

(homeostatically) expressed

slide-21
SLIDE 21

Lambda phage model: graph of strongly connected components (SCCG)

lysogeny lysis

slide-22
SLIDE 22

CI↓ Cro↑ CII↓ N↓ CI↓ Cro↑ CII↓ N↓ Cro↑ CI↑ CI↑ CII↓ N↓ Cro↓

Lambda phage model: hierarchical state transition graphs (HTG)

lysogeny

  • nly CI expressed

lysis

  • nly CRO (homeostatically)

expressed

Cro↓

cyclic attractor transient cycle stable state transient pathways

HTG computation on the fly using Tarjan algorithm + decision diagrams

slide-23
SLIDE 23

Content of HTG components (schemata)

Component Type Number of states Schemata CI Cro CII N i-7 transient paths 7 * 1 1 1 * * i-3 transient paths 3 2 1 2 1 * ct-31 transient cycles 31 1 * 1 1 1 2-3 1 2-3 1 * 1 1 * * 1 2-3 1 1 2-3 1 * 2 1-3 * * ct-2 transient cycle 2 1 2-3 ss-2000 Stable state 1 2 ca-2 cyclic attractor 1 2-3

slide-24
SLIDE 24

Regulatory circuits: dynamics in isolation

stable states attracting cycle

A B C D

Positive circuit

A B C D

Negative circuit

Remy et al (2003) Bioinformatics 10: ii172-8

slide-25
SLIDE 25

Regulatory circuits & Thomas' rules

  • A positive regulatory circuit is necessary to generate

multiple stable states or attractors

  • A negative regulatory circuit is necessary to generate

sustained oscillatory behaviour

  • Thomas R (1988). Springer Series in Synergics 9: 180-93.

Mathematical theorems and demonstrations:

  • In the differential framework:
  • Thomas (+, 1994), Plathe et al. (±, 1995), Snoussi (±,

1998), Gouzé (±, 1998), Cinquin & Demongeot (+, 2002), Soulé (+, 2003).

  • In the discrete framework:

Aracena et al. (+, 2001), Remy et al. (±, 2005), Richard & Comet (+, 2005).

slide-26
SLIDE 26

Regulatory circuit functionality

A B C D Circuit properties depends on the effect of A on B If A alone is able to switch OFF B:

  • In the presence of A:

→ only one stable state with {A,B,C,D}= 1011

  • In the absence of A:

→ two stable states 0100 and 0011

  • The positive cross-inhibitory circuit

involving B and C is thus functional

  • nly in the absence of A

Development of a computational algorithm enabling the analysis of the functionality of regulatory circuits in the discrete case => GINsim

slide-27
SLIDE 27
slide-28
SLIDE 28
slide-29
SLIDE 29

CD4+ T-helper cell differentiation

Multiple signalling pathways Various transcriptional factors Specific expression patterns (TFs and lymphokines)

slide-30
SLIDE 30

Logical modelling

  • f Th activation

Klamt S et al (2006). BMC Bioinformatics 7: 56.

slide-31
SLIDE 31

Logical modelling of Th1/Th2 cell differentiation

Mendoza L (2006). BioSystems 84: 101-14.

slide-32
SLIDE 32

Towards a comprehensive, modular logical model

  • f the Th differentiation network

!"#" $% $%&' !"# $%&( Yamoka et al (2004)

ILR = 1 IFF IL AND ILR1 AND ILR2

slide-33
SLIDE 33

!"#" $%&' $%() $%( $%(* $% ILR = 1 IFF (IL OR IL_e) AND ILR1 AND ILR2

Logical modelling of the Th network

slide-34
SLIDE 34

IL = 1 IFF NFAT AND proliferation AND ...

Logical modelling of the Th network

!"#" $%&' $%() $%( $%(* $% +,-./01,23/-4 $%*( !"#"5 "6( 78#" $%*&'

$%*(9 $%*(: $%*(2

slide-35
SLIDE 35

!"#$%

!"#&' !"#&(

)*+*, !-./$%

!-./&,

!-./&

!-./&# !"#&0

!"#& )*+*1 )*+*2 !"3$% !"3&

!"3&+

Multiple uses

  • f receptor

chains

Logical modelling of the Th network

Ternary variables Converging signals

slide-36
SLIDE 36

IRF1 IL4 CGC IFNB_e IL12_e STAT3 IL12RB2 IL4R IL17 TBET IL10 IL23R GP130 IL21 STAT6 IL6_e proliferation APC IL15_e CD28 IL2 IL12RB1 IFNGR1 IFNGR STAT4 SMAD3 IL2R IL4_e IFNG IL6RA IL4RA STAT1 IFNGR2 IL15RA IKB TCR IL10_e IL15R TGFB_e IFNG_e IL10RB IL10R IL23_e IL2RA NFKB STAT5 NFAT IL27RA IL27_e IL2_e TGFBR RORGT RUNX3 IFNBR IL10RA IL21R GATA3 IL21_e IL6R TGFB IL23 IL27R IL12R FOXP3 IL2RB

13 input components, 52 internal components, 339 circuits => too large to perform simulations

Current logical model of the Th network

Naldi et al (2010) PLoS Comput Biol 6: e1000912.

slide-37
SLIDE 37

Model Reduction

Detailed model Reduced model Comprehensive Easier to analyse Difficult to analyse Loss of information

  • Biological (indirect effect)
  • Dynamical (delays)
slide-38
SLIDE 38

Implementation of user defined model reductions

X T T R3 R1 R3 R1 R2 R2

  • Keep the detailed model
  • Reduction before analysis

=> New rules for targets

  • f hidden nodes
  • Choice of reduction
  • Dynamical consistency
  • No circuit deletion
  • Same stable states
  • Reachability may change

Naldi et al (2011) Theoretical Computer Science 412: 2207-18.

slide-39
SLIDE 39

RORGT IL2_e IL10_e NFAT FOXP3 STAT3 IL17 IL21_e STAT4 IL2R IL21 IL10 GATA3 proliferation APC STAT5 TGFB IL6_e TGFB_e IFNG STAT1 IL4_e IL23 IL2 STAT6 IFNG_e IFNB_e IL15_e IL2RA IL4 IL27_e TBET IL12_e IL23_e

Reduced logical model

13 input components, 21 internal components

slide-40
SLIDE 40

Selected environments for simulations

APC IL2 IL4 IL6 IL10 IL12 IFNG TGFB No input APC Pro-Th1 Pro-Th1’ Pro-Th2 Pro-Th17 Pro-Treg Pro-Treg’

slide-41
SLIDE 41

IL2R IL2RA IFNG IL2 IL4 IL10 IL21 IL23 TGFB TBET GATA3 FOXP3 NFAT STAT1 STAT3 STAT4 STAT5 STAT6 proliferation RORGT IL17 Support

Th0 [7] Activated Th0 [7] Th1 [7] Activated Th1 [7] Anergic Th1 [78] Anergic Th1 RORγt+ predicted Th1 RORγt+ [44,45,70] Th1 Foxp3+ [12] Anergic Th17 Th2 [7] Activated Th2 [7] Anergic Th2 [78] Th2 RORγt+ [49] Activated Treg [79] Treg RORγt+ [46–48] Th1 Foxp3+ RORγt+ predicted Th2 Foxp3+ RORγt+ predicted

Stable signatures

slide-42
SLIDE 42

Simulations (Hierarchical Transition Graphs)

Pro TH2 (IL4, IL6)

ss-1001110000000210011110010101021100 i#255

IL2- IL4+ IL10+ IL21+ IL23+

Activated Th2

i#25 ss-1001000000000210100000000100020100

APC + IL2

IL2+ Proliferation+

Activated Th0

ss-1011000000000211000000100110020100 i#79

Pro Th1 (IFNG)

IFNG+ IL2-

Activated Th1

ss-1001000000001210000001001100020100 i#37

Pro Treg (TGFB)

IL2- TGFb+

Activated Th0

Node order: APC, IFNB_e, IFNG_e, IL2_e, IL4_e, IL6_e, IL10_e, IL12_e, IL15_e, IL21_e, IL23_e, IL27_e, TGFB_e, IL2R, IL2RA, IFNG, IL2, IL4, IL10, IL21, IL23, TGFB, TBET, GATA3, FOXP3, NFAT, STAT1, STAT3, STAT4, STAT5, STAT6, Proliferation RORGT and IL17.

slide-43
SLIDE 43

Simulations (HTG)

ss-1001010000001210101110000101020110 i#39 i#91 ss-1001010000001210001111001101020110 i#66

Pro Th17 (TGFB, IL6)

RORGT+ RORGT+ IL2+ IL10+ IL21+ IL23+ IL2- IL10+ IL21+ IL23+ TGFB+ RORGT+ FOXP3+

Activated Th17 FOXP3- Activated Th17 FOXP3+

Node order: APC, IFNB_e, IFNG_e, IL2_e, IL4_e, IL6_e, IL10_e, IL12_e, IL15_e, IL21_e, IL23_e, IL27_e, TGFB_e, IL2R, IL2RA, IFNG, IL2, IL4, IL10, IL21, IL23, TGFB, TBET, GATA3, FOXP3, NFAT, STAT1, STAT3, STAT4, STAT5, STAT6, Proliferation RORGT and IL17.

slide-44
SLIDE 44

ss-1000110000001010000000011101011010 ss-1000110000001010001111011101021110 i#54 i#11 ss-1000110000001010011110010101021110 i#35 i#595 i#24 i#143 i#112(1) ss-1000110000001010000000010101011010 i#56

i#112(2)

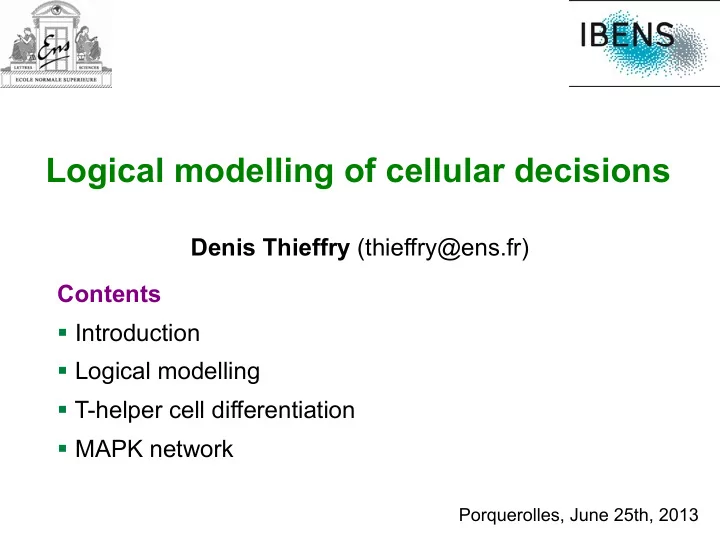
RORGT+ IL2R- IL2- STAT5+ STAT6+ STAT5+ FOXP3+ FOXP3+ IL2R- IL2- STAT6+ STAT5+ IL2- STAT5+ STAT5+ RORGT+ RORGT+ FOXP3+ RORGT+ RORGT+ FOXP3+ IL2R- IL2- IL2- STAT5+ IL2R- IL2RA+ GATA3+ IL10+ IL2R- IL4R+ IL21+ IL23+ IL2R- IL2RA+ GATA3+ RORGT+ IL2R- IL4- IL10+ IL21+ IL23+ TGFB+ GATA3+ RORGT+

Anergic GATA3+ RORGT+ Activated GATA3+ RORGT+ IL4+ IL10+ IL21+ IL23+ Anergic GATA3+ RORGT+ FOXP3+ Activated GATA3+ RORGT+ FOXP3+ IL10+ IL21+ IL23+ TGFB+

Simulations (HTG)

APC + IL4 + IL6 + TGFB (pro Th2 + Th17 cytokines, in the absence of IL2)

Node order: APC, IFNB_e, IFNG_e, IL2_e, IL4_e, IL6_e, IL10_e, IL12_e, IL15_e, IL21_e, IL23_e, IL27_e, TGFB_e, IL2R, IL2RA, IFNG, IL2, IL4, IL10, IL21, IL23, TGFB, TBET, GATA3, FOXP3, NFAT, STAT1, STAT3, STAT4, STAT5, STAT6, Proliferation RORGT and IL17.

slide-45
SLIDE 45

Simulations in the absence of stimulation

GATA3, Tbet, Foxp3 and RORγt

slide-46
SLIDE 46

Pro Th2 environment (IL4 & IL6)

GATA3, Tbet, Foxp3 and RORγt

slide-47
SLIDE 47

Pro Treg environment (IL2 & TGFb | IL10)

GATA3, Tbet, Foxp3 and RORγt

slide-48
SLIDE 48

Overview of the simulation results for ≠ micro-environments

Absence of stimulation Pro-Th1 IL2 & IFNg

  • r IL12

APC only Pro-Th2 IL4 & IL6 Pro-Treg IL2 & TGFb

  • r IL10

Pro-Th17 IL6 & TGFb

GATA3 Tbet Foxp3 RORγt

Naldi et al (2010) PLoS Comput Biol 6: e1000912.

slide-49
SLIDE 49

Use of model checking to assess cell plasticity

  • Export of GINsim models

into NuSMV format

  • Specification of

perturbation and stable patterns using temporal logic formula

  • Graphical output

Monteiro & Chaouiya (2012) Adv Intell Soft Comput 154: 259–67. Bérenguier et al (2013) Chaos, in press.

slide-50
SLIDE 50

Regulatory circuit analysis

Functional positive circuits Negative circuits

slide-51
SLIDE 51

Conclusions

  • Model reproducing the main reported Th subtypes

(Th0, Th1, Th2, Treg, Th17) in terms of stable states

  • Many more stable states depending on signalling environment,

including hybrid subtypes

  • Plasticity of Th subtypes depending on signalling environment
  • Differentiation network rather than lineage tree
slide-52
SLIDE 52

Prospects

  • Simulations of mutants and other perturbations (e.g.

different timing for combinations of external signals)

  • Extension of cellular model (additional pathways,

transcription factors, interactions)

  • Incorporation of high-throughput datasets (transcriptomics,

proteomics) in collaboration with Vassili Soumelis, Institut Curie

  • Consideration of novel subtypes
  • Quantification of alternative outcomes
slide-53
SLIDE 53

Contributors & supports

★ ENS (Paris)

  • Wassim Abou-Jaoudé
  • Samuel Collombet
  • Jérôme Feret
  • Anna Niarakis
  • Morgane Thomas-Chollier

★ Institut Curie (Paris)

  • Emmanuel Barillot
  • Eric Bonnet
  • Laurence Calzone
  • Philippe Hupé
  • Vassili Soumelis
  • Maxime Touzot
  • Andrei Zinovyev

★ TAGC (Marseille)

  • Luca Grieco
  • Aurélien Naldi
  • Brigitte Kahn-Perlès
  • Jacques van Helden

★ IML (Marseille)

  • Duncan Berenguier
  • Elisabeth Rémy

★ IGC (Lisboa)

  • Claudine Chaouiya
  • Jorge Carneiro
  • Pedro Monteiro

Belgian Inter-university Attraction Pole Bioinformatics and Modelling : from Genomes to Networks

slide-54
SLIDE 54

Selected references

  • Bérenguier D, Chaouiya C, Monteiro PT, Naldi A, Remy E, Thieffry D, Tichit L

(2013).Dynamical modeling and analysis of large cellular regulatory networks.

  • Chaos. In press.
  • Monteiro PT, Chaouiya C (2012). Efficient verification for logical models of

regulatory networks. Adv Intell Soft Comput 154: 259–67.

  • Naldi A, Thieffry D, Chaouiya C (2007). Decision diagrams for the representation

and analysis of logical models of genetic networks. Lecture Notes in Bioinformatics 4695: 233-47.

  • Naldi A, Remy E, Thieffry D, Chaouiya C (2011). Dynamically consistent reduction
  • f logical regulatory graphs. Theoretical Computer Science 412: 2207-18.
  • Naldi A, Carneiro J, Chaouiya C, Thieffry D (2010). Diversity and plasticity of Th

cell types predicted from regulatory network modelling. PLoS Computational Biology 6: e1000912.