
LANARKSHIRE Well-being Indicator Dr David Best
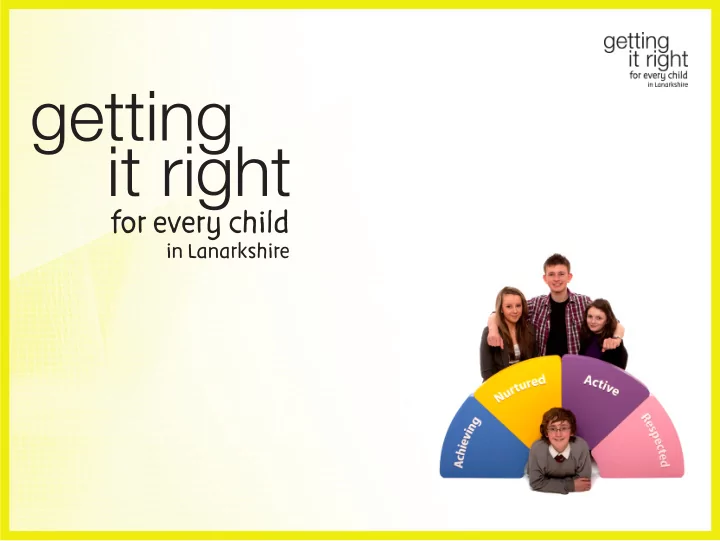
GIRFEC Wheel
Background ∙ Getting it right for every child (GIRFEC), a national approach in supporting and working with all children and young people in Scotland ∙ GIRFEC was developed in order to refmect initiatives, studies and reports that had been carried out in services for children ∙ GIRFEC aims to improve the life chances of vulnerable children, although the words “every child” are of paramount importance
Rationale ∙ The current project builds on the success of GIRFEC by using the domains of the well-being indicator as the basic structure for the instrument ∙ Well-being indicators: Safe Healthy Achieving Nurtured Active Respected Responsible Included ∙ Children’s well-becoming: Confjdent individuals Effective contributors Successful learners Responsible citizens
Rationale ∙ The instrument also uses ‘strength’ and ‘risk’ factors which have been used in an adult well-being measure – the Assessment of Recovery Capital (ARC, Best et al. in preparation) ∙ Measuring well-being generically is more useful than an explicit measure of substance problems
Testing Process ∙ Testing acceptability – using a steering group and with a focus group of young people ∙ This led to substantial changes to the questionnaire and the information provided to young people ∙ School-based testing: three aspects of the psychometrics of the instrument were assessed 1.) Factor structure 2.) Test-retest reliability analysis 3.) Concurrent validity
Descriptives ∙ A total of 803 young people took part in the school phase of the analysis and Table 1 below shows the range of schools that they were attending Table 1: Breakdown of schools involved in the pilot work Frequency Percent Valid Abronhill High 96 12.0 Braidhurst High 76 9.5 Cathkin High 57 7.1 Kilsyth High 77 9.6 Larkhall Academy 76 9.5 St Aidan's High 131 16.3 St Ambrose High 96 12.0 Strathaven Academy 130 16.2 Kilsyth – retest 64 8.0 Total 803 100.0
Descriptives ∙ Table 2 below gives the breakdown of the school year for each of the pupils participating Table 2: School year of participants Frequency Percent Valid S1 103 12.8 S2 165 20.5 S3 197 24.5 S4 122 15.2 S5 132 16.4 S6 79 9.8 Total 798 99.4 9 5 .6 Missing Total 803 100.0
Norms The overall pattern of threats and strengths are shown in Table 3 and Figure 1 below Table 3: Overall average scores for strengths and threats Figure 1: Overall profjle of strengths and threats Strengths Threats Safety 4.2 0.4 Health 3.8 1.2 Achieving 4 1.6 Nurture 4.6 0.3 Activity 3.4 1.2 Respect 2.9 0.9 Responsibility 3.3 0.9 Inclusion 3.9 1.3
Norms ∙ The overall pattern of threats by year are shown in table 4 Table 4: Mean threat scores by year Safety Health Achieving Nurture Activity Respect Respons Inclusion S1 0.4 0.9 1.3 0.3 0.8 1 1.2 1.6 S2 0.6 1.1 1.4 0.4 1.1 0.9 0.9 1.3 S3 0.4 1.2 1.7 0.3 1.3 0.9 1 1.4 S4 0.6 1.4 2 0.4 1.3 0.9 0.8 1.2 S5 0.3 1.2 1.3 0.2 1 0.8 0.7 1 S6 0.4 1.5 1.7 0.3 1.5 1 0.6 1.2
Norms Figure 2: Threat scores by year
Practice ∙ The next stage is to have a go at fjlling in the questionnaire for yourself ∙ Please complete it as a role-play – being an imaginary or real young person accessing the service
How & when to use ∙ Baseline ∙ At appropriate subsequent follow-up points ∙ The key measure is change ∙ Recording and coding the results ∙ Use as a clinical marker
Scoring Guide ∙ Each section has two scores – one for strengths and one for risks or threats ∙ Both of these will be between 0-5 ∙ You can also work out a total score for strengths (0-40) ∙ And for threats (0-40) ∙ And you can compare to an ‘average’ school population
Pilot data and next steps ∙ Complete with all new clients ∙ Take a copy for your case fjles ∙ Collate a central copy and UWS research team will collect ∙ The pilot will run for three months ∙ We are trying to establish service norms and change measures
Interpreting and using the results ∙ The aim is to use as the basis for evaluation ∙ So what we are hoping to see is change in key indicators ∙ However, it may also direct your attention to key areas for therapeutic focus and intervention ∙ Intractable risk areas may require a more intensive intervention ∙ High correlations with the SDQ mean that there are grounds for clinical utility
Evaluation ∙ We will feed back early in the new year ∙ But implementation is as important as the statistics ∙ Please give us feedback about how easy it is to use and what the response is like for the young people ∙ If this works, the next stage will be about using it as a therapeutic tool
Recommend
More recommend