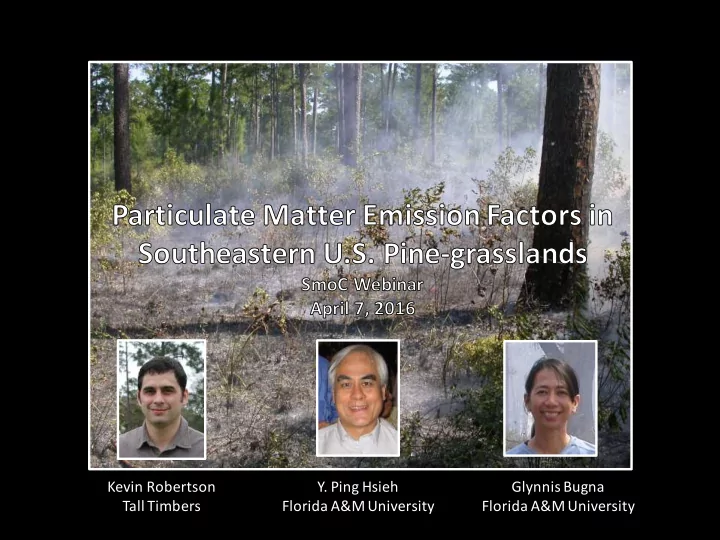

Kevin Robertson Y. Ping Hsieh Glynnis Bugna Tall Timbers Florida A&M University Florida A&M University
H 2 O CO 2 C x H y O z + 2O 2 CO PM NO, NO 2 VOCs (CH 4 , PAHs)
PM 2.5 Emission Factor (EF) = PM 2.5 emitted / fuel consumed
Emissions Inventories Burned Area Fuel Loading Fuel Consumption Emission Factor Emission Production Rate Dispersion/Concentration
Factors potentially influencing EF PM2.5 • Combustion phase (flaming, smoldering, glowing) • Combustion efficiency (CO 2 / total C released) • Fuel moisture • Fuel bulk density (packing ratio) • Fuel composition • Fire behavior • Community type • Season • Weather • Time since fire
Rx fires 0.96 0.94 0.92 MCE Chaparral 0.90 Grass Pocosin, palmetto 0.88 Conifer forest wildfires 0.86 Mountain west southeast Urbanski et al. 2012
Purpose • Investigate effects of fire environmental conditions and ecological variables on PM 2.5 emission factors within southeastern U.S. pine-grassland communities • Suggest whether or not developing models to predict PM 2.5 emissions using such conditions as input would improve emissions estimates
A GEORGIA Red Hills Region Ú Ê # FLORIDA Gulf of Mexico 50 0 50 Miles
Methods • Measure a EF PM2.5 in the field from the ground during prescribed burns across a range of common environmental conditions • Use Structural Equation Modeling to identify variables influencing EF PM2.5 and their interactions
Fire Environmental Variables: Fuel load, moisture, and consumption • Live herbaceous • Aerated 1-hr (0-0.6 cm dead grass, pine needles, etc.) • Fine 1-hr unaerated (smaller particles) • 10-hr (0.6-2.5 cm) • Bed depth and density • Time since fire
Fire Environmental Variables: Fire behavior Heat per unit area (kJ m -2 ) • Reaction Intensity (kJ m -2 s -1 ) • Fireline Intensity (kJ m -1 s -1 ) • • Flaming and smoldering residence time • Maximum temperature • Flame length • Rate of spread • Ignition type (backing, heading)
Fire Environmental Variables: Weather • Relative humidity • Ambient temperature • Wind speed • Keetch-Byrum Drought Index • Season
Tall Timbers Fire Ecology (Stoddard) Plots 2 Year Interval 1 Year Interval 3 Year Interval
Pebble Hill Fire Plots, Thomasville, Georgia 4 months post-burn 1 year post-burn 3 years post-burn 4 years post-burn
Pebble Hill Fire Plots, Thomasville, Georgia September 2009 February 2010
Emission factors PM emitted (g) EF PM = Fuel consumed (kg) PM plume - PM ambient EF PM = w * C plume - C ambient
Emission intake PM, CO 2 , CO sample
Principal Component Analysis (PCA) – Reduce variables
Structural Equation Model (SEM) – Theoretical model
Structural Equation Model (SEM) – Initial model
Structural Equation Model (SEM) – Final model
8.4 m 2 ha -1 (36 ft 2 /acre) 15% needles EF PM2.5 = 15.4 g kg -1 18 m 2 ha -1 (78 ft 2 ac -1 ) 29% needles EF PM2.5 = 24.1 g kg -1
TP = 20 C (68 F) RH = 38 VD = 7.0 EF PM2.5 = 18.8 g kg -1 TP = 33 C (91 F) RH = 47 VD = 15 EF PM2.5 = 24.3 g kg -1
Conclusions • Fuel characteristics have significant effects on EF PM2.5 in periodically burned southern pine-grasslands • Lowest EF PM2.5 was associated with low pine stocking, high grass loads, frequent burning, and dormant season burns • Model development for predicting EF PM2.5 based on forest structure and fuel composition should improve the accuracy of PM emission estimates • Low EF PM2.5 conditions generally correspond with goals for ecological management of this community type, apart from dormant season burning • Effect of season on EF PM2.5 appears to be because of air moisture rather than fuel moisture • Growing season burns promote grass cover over time which might offset higher EF PM2.5
Emission factors Mass balance method PM plume - PM ambient EF PM = * w C PM + C plume - C ambient Carbon isotope method PM plume - PM ambient EF PM = * w d13C plume – d13C ambient C PM + C plume ( ) d13C fuel – d13C ambient
Plume Ambient CO 2 CO 2 CO 2 O 2
Emission factor assumption: PM plume and CO 2plume are evenly mixed PM:CO 2 PM:CO 2 PM:CO 2 PM:CO 2
Emission factor assumption: PM plume and CO 2plume are evenly mixed
PM 2.5 conc Fire-CO 2 MCE EF PM2.5 (mg m -3 ) (ppm) (g kg -1 ) 2.0 m 2.3 340 0.97 5.8 0.3 m 20.4 3020 0.91 5.3
PM 2.5 conc Fire-CO 2 MCE EF PM2.5 (mg m -3 ) (ppm) (g kg -1 ) 2.0 m 1.4 255 0.94 5.3 3.1 56 0.94 46.4
MESTA thermograms
Conclusions • Ambient CO 2 concentrations are increased in the fire plume relative to ambient air conditions • There is a non-stoichiometric relationship between ambient CO 2 + O 2 and gaseous products of combustion that results in a systematic 15% (±2%) under-estimation of EF PM2.5 using the traditional mass balance method • The assumption that emitted PM 2.5 and CO 2 are well mixed holds true only within flaming combustion convection column • Conversely, emitted PM 2.5 and CO 2 are rapidly decoupled (<1 hr) where convective mixing is weak • Such conditions might include the turbulent edges and exterior of convection columns and convection from low-energy combustion (low intensity flaming or smoldering combustion)
Thanks to: National Science Foundation Angie Reid George Bruner Tracy Hmielowski Eric Staller Bailey Spitzner Meredith Liedy Djanan Nemours Marcos Colina Vega Josh Picotte Tim Malo Christopher Odezulu Kevin Robertson krobertson@ttrs.org
Recommend
More recommend