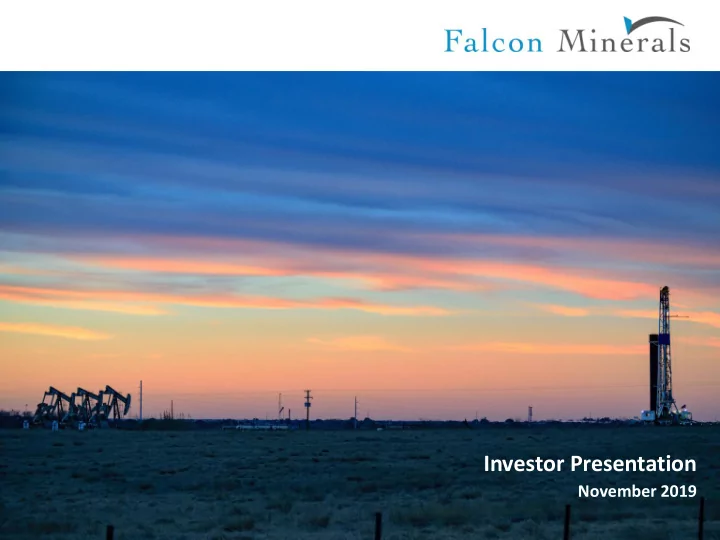
Investor Presentation November 2019 Disclaimer FORWARD-LOOKING - PowerPoint PPT Presentation
Investor Presentation November 2019 Disclaimer FORWARD-LOOKING STATEMENTS Certain statements contained in this Presentation, which reflect the current views of Falcon with respect to future events and financial performance, and any other
Investor Presentation November 2019
Disclaimer FORWARD-LOOKING STATEMENTS Certain statements contained in this Presentation, which reflect the current views of Falcon with respect to future events and financial performance, and any other statements of a future or forward-looking nature, constitute “forward -looking statements” for the purposes of federal securities laws. These forward-looking statements include, but are not limited to, statements with respect to strategy, future operations, financial position, estimated revenues, and losses, projected costs, prospects, plans and objectives of management. In addition, any statements that refer to projections, forecasts or other characterizations of future events or circumstances, including any underlying assumptions, are forward-looking statements. The forward-looking statements contained in this Presentation are based on Falcon’s current expectations and beliefs concerning future developments and their potential effects on Falcon. There can be no assurance that future developments affecting us will be those that we have anticipated. These forward-looking statements involve a number of risks, uncertainties (some of which are beyond Falcon’s control) or other assumptions that may cause actual results or performance to be materially different from those expressed or implied by these forward-looking statements. A description of certain risks and uncertainties and factors that could cause actual results to differ materially from past results and future plans and projected and estimated future results can be found in Falcon’s filings with the U.S. Securities and Exchange Commission (the “SEC”), including our definitive proxy statement filed with the SEC on August 3, 2018, which are available free of charge at www.sec.gov. Neither Falcon nor its affiliates or representatives assumes any obligation to update or correct any forward- looking statements or other information contained in this Presentation. RESERVE INFORMATION Reserve engineering is a process of estimating underground accumulations of hydrocarbons that cannot be measured in an exact way. The accuracy of any reserve estimate depends on the quality of available data, the interpretation of such data and price and cost assumptions made by reserve engineers. In addition, the results of drilling, testing and production activities may justify revisions of estimates that were made previously. If significant, such revisions could impact Falcon’s strategy and change the schedule of any further production and development drilling. Accordingly, reserve estimates may differ significantly from the quantities of oil and natural gas that are ultimately recovered. Estimated Ultimate Recoveries, or “EURs,” refers to estimates of the sum of total gross remaining proved reserves per well as of a given date and cumulative production prior to such given date for developed wells. These quantities do not necessarily constitute or represent reserves as defined by the SEC and are not intended to be representative of all anticipated future well results. 2
Overview Falcon’s primary assets are located in the core of the Eagle Ford under premier operators and benefit from premium pricing Market / Asset Overview Core of the Core Eagle Ford NASDAQ Ticker FLMN Market Capitalization (1) ~$555mm Shares Outstanding (2) ~86.0mm Leverage Ratio (3) 0.55x Liquidity (4) ~$55mm Key Counties Karnes, Dewitt, Gonzales BP / Devon, ConocoPhillips, Key Operators EOG, Ensign Gross Unit Acres ~256,000 acres Net Royalty Acres ~2,670 acres Producing Horizontal Wells ~1,867 Eagle Ford wells World class assets developed by world class operators (1) Assumes share price as of November 11, 2019. Inclusive of Class C Shares. (2) 85,950,716 shares reflect fully-diluted or as-converted shares outstanding, inclusive of 40,000,000 Class C shares. Excludes Distribution Equivalent Rights. (3) Calculated by dividing the sum of total debt outstanding less cash on hand as of September 30, 2019 by Adjusted EBITDA for the trailing 12- month period, as per Falcon’s credit agreement dated August 23, 2018. (4) Liquidity reflects redetermined borrowing base of $90 million as of November 8, 2019. 3
Investment Highlights ❑ Announced 3Q ‘19 dividend of $ 0.135; LTM aggregate distributions of $0.66 implies a 10.2% LTM yield (1) ❑ Averaged net production of 4,825 Boe/d (56% oil Eagle Ford / 50% oil total) during 3Q ‘19 ❑ Net income of $6.4 million (2) , or $0.06 per Class A share for 3Q ‘19 ❑ Adjusted EBITDA of $12.3 million for 3Q ‘19 3Q ‘19 Review ❑ Averaged seven rigs running on Eagle Ford position during 3Q ’19 ❑ Maintained low leverage profile → 0.55x (3) levered at 3Q ‘19 ❑ Closed three acquisitions totaling $0.9 million during 3Q ‘19 ❑ Production guidance for 4Q ‘19 / 1Q ‘20 set at 5,000 – 5,500 Boe/d (50% - 55% oil) ❑ Karnes Trough is characterized by some of the lowest breakeven returns to operators in North American shale ❑ Eagle Ford benefits from premium pricing → ~$4.00 favorable to benchmark WTI Core of the Core ❑ Ample infrastructure ensures takeaway capacity from the region Assets ❑ World class operators remain committed to Eagle Ford development and are re-developing pay targets with refracturing and enhanced oil recovery, as well as developing additional zones in the Austin Chalk ❑ 207 line of sight wells (2.82 net wells) currently in active development, an increase of 16% from 2Q ‘19 ❑ 118 wells currently waiting on completion (1.69 net wells) Line of Sight ❑ 32 wells currently waiting on connection (0.36 net wells) Development ❑ Four Hooks Ranch wells, in which Falcon has a 22.5% net revenue interest, were drilled to total depth by ConocoPhillips in October 2019 (4) → anticipate production in 1Q ’20 Unique business model within energy landscape and across public markets → Zero capex, low leverage, embedded Falcon Highlights growth, margins in excess of 75%, premium pricing, and world class operators (1) Yield based on November 11, 2019 closing share price. (2) Net Income shown includes amounts attributable to non-controlling interests. (3) Calculated by dividing the sum of total debt outstanding less cash on hand as of September 30, 2019 by Adjusted EBITDA for the trailing 12- month period, as per Falcon’s credit agreement dated August 23, 2018. (4) The four recently spud Hooks Ranch wells will extend the laterals from the Hooks Ranch positions into an adjacent leasehold property where Falcon has a 3.65% NRI. The net NRI contribution from the four wells will be approximately 14.2%. 4
A History of Market Leading Returns Falcon’s management team has a long history of creating energy enterprises (Atlas companies) and providing substantial shareholder returns Atlas Energy grows to become one of the Atlas Pipeline expands into a leading most active developers in the early stages gathering & processing enterprise in the of the Marcellus Shale Permian and Mid-Continent regions Atlas Energy sold to Chevron for $4.3 billion 2011 > 900% return from IPO (46% CAGR) Atlas Pipeline sold to Targa for $7.7 billion 2015 > 400% return from IPO (11% CAGR) 5
A Model of Consistent Free Cash Flow Falcon’s royalty business offers a unique business model that provides consistent, high cash margin returns to shareholders Core oil-rich Eagle Ford position + Top-tier producers No capital spending + Low operating costs High cash flow margins in excess of 75% Dividend payout of > 90% 6
World Class Operators Developing Falcon’s Position Operators on Falcon’s Position Operators BP / DVN ❑ Currently running seven rigs across the Eagle Ford COP ❑ Indicated potential addition of an eighth rig in 2020 EOG in order to reach optimal and sustained development ❑ Currently running four rigs across the Eagle Ford ❑ Partnership transition from BHP to BP complete with operational momentum reestablished ❑ Plan to bring online more than 25 Eagle Ford wells in 4Q ’19 ❑ Actively completing refrac and redevelopment inventory; over 700 potential locations ❑ Currently running eight rigs across the Eagle Ford ❑ Continuing to methodically develop Eagle Ford / Austin Chalk position with 10+ years of growth ❑ Aggressively targeting Enhanced Oil Recovery (EOR) program with over 200 wells identified ❑ Exceeded full year well cost reduction goal of 5% in 3Q ‘19 ❑ Recently announced average drill times were reduced by 10% - 20% → drilled fastest well to date in Eagle Ford in 2.4 days Over $200bn of market capitalization across Falcon’s top operators 7
Substantial Remaining Inventory Across the Basin and Key Operators Sorted by Highest Total Remaining Inventory 4,500 Inventory Percent developed 4,000 71% 70% Remaining inventory 3,500 66% 62% 60% 3,000 58% 57% 58% 57% 55% 50% 51% 49% 48% 48% 2,500 47% 43% 44% 44% 43% 40% 38% 2,000 34% 30% 31% 31% 29% 30% 29% 29% 1,500 1,000 500 0 VERDUN OIL &… EOG BP COP CHK MARATHON LEWIS PVAC VENADO BAYTEX* MURPHY ENSIGN GULFTEX EQUINOR BLACKBRUSH LONESTAR SANCHEZ ENCANA ESTE SILVERBOW DEVON EP ENERGY SUNDANCE MAGNOLIA CARRIZO ESCONDIDO HAWKWOOD SM ENERGY SABINE* EXCO Remaining Locations by Play and PV-10 Breakeven ($ / Bbl; 20:1 WTI:HH) 160 Remaining locations ('000's) 140 120 100 80 60 40 20 0 <$35 $35-$40 $40-$45 $45-$50 $50-$55 >=$55 Source: CS A&D, RSEG. 8
Recommend


More recommend
Explore More Topics
Stay informed with curated content and fresh updates.