Intensity fluctuations during Event 50 RV Sharp Source & Shark - PowerPoint PPT Presentation
Intensity fluctuations during Event 50 RV Sharp Source & Shark VLA Receiver Badiey, Katsnelson, Lynch Acoustical Society of America Meeting Miami, Fl. November 10, 2008 Acknowledgements we are thankful to: Many colleagues who have
Intensity fluctuations during Event 50 RV Sharp Source & Shark VLA Receiver Badiey, Katsnelson, Lynch Acoustical Society of America Meeting Miami, Fl. November 10, 2008
Acknowledgements we are thankful to: • Many colleagues who have made it possible, both before, during, and after the experimental program • Crew of RV Sharp, RV Oceanus, and their personnel • ONR for making it all possible and for their long term commitment
Long-Term Goals Obtain quantitative understanding of the physics governing the broadband frequency (50 Hz to 500 Hz) acoustic signal propagation, reflection, refraction, and scattering in shallow water and coastal regions in the presence of temporal and spatial ocean variability.
Background • SWARM Experiment • Theoretical development • ASIAEX Studies • SW06 Experiment – Event 50 (Source 1) – Event 50 (Source 2) • Summary
Background • Oceanographic observations of shallow water internal waves [Zhou et al. (1991), Rubenstein et al. (1991), Rubenstein (1999)]. • SWARM95 observation of acoustic effects [Badiey et al. ( 2002)]. • Theoretical explanation and hypothesis [Katsnelson et al. JASA 117(2), 2005 and JASA 122(2), 2007].
Experiment Waveguide Internal Signal Results Experiment Waveguide Internal Signal Results solitons solitons Zhou et al . (1991). JASA Yellow sea Hypothesized Broadband Freq. fluct. > 20 dB α > 45 o 90(4), 2042-2054 L= 28 km; D=40 m 100-1000 Hz Resonant mode Coupling Rubenstein & Brill, Ocean Washington coast N~10 cph Narrowband Temp. intens. fluct. ~ Variability and Acoust., 3 dB L=18.5km; D=150m Ampl ~ 10 m f = 400 Hz 215-228 (1991). α ~ 10-15 o Adiabatic fluctuations Rubenstein, D. (1999) Gulf of Mexico N ~ 15–20 cph Narrowband Temp. intens. fluct. ~ IEEE J. Oceanic Eng. 2 dB L= 30km; D=185m Ampl ~ 10 m f = 240 Hz 24(3), 346-357. α ~ 30 o Mode coupling Badiey, Lynch, et al. New Jersey shelf N ~ 10-15 cph Broadband 30-160 Hz Space-time int. fluct.~ (2002). IEEE J. Oc.Eng., 6-7dB L=15 km; D=70 m Ampl ~ 12 m and LFM 50-250 Hz v.27, N1, 117-129. α ~ 5 o 3D effects (horizontal refraction) Badiey, Lynch, et al. New Jersey shelf N ~ 10-15 cph Broadband 30-160 Hz Space-time int. (2002). IEEE J. Oc.Eng., fluct.~2-3 dB L=19 km; Ampl ~ 12 m and LFM 50-250 Hz v.27, N1, 117-129. α ~ 35-40 o Mode coupling D=70-100m Badiey, Katsnelson, Lynch, New Jersey shelf N ~ 10-15 cph Broadband 30-160 Hz Space-time int. fluct.~ et al. JASA 6-7dB L=15 km; D=70 m Ampl ~ 12 m α ~ 5 o 2005 - 117(2), 613-625. 3D effects Frequency 2007 - 122(2), 747-760. dependence
SW06 Experiment • Multi-disciplinary, multi-institutional, multi- national efforts • New Jersey continental shelf where SWARM95 was conducted • Mid-July to mid-September 2006 • 62 acoustics and oceanographic moorings deployed in ‘T’ geometry (along- and across-shelf paths) • 5 main research vessels: R/V Knorr, R/V Oceanus, R/V Endeavor, R/V Sharp, CFAV Quest
SW06 Experiment • Objectives –Investigate 3D effects of internal wave (IW) on the broadband acoustic propagation: • Azimuthal dependency of the field due to IW propagation. • Study different regimes of propagation: adiabatic, horizontal refraction, mode coupling, and the transitions between them. –Investigate effects of environment on the underwater acoustic communication.
SWARM-95 Experiment ~ 20 m ~ 100 m Wave fronts of 15 km internal waves 6 km
August 4, 1995 19:00 – 20:00 GMT 20:00 – 21:00 GMT
Different mechanisms of acoustic propagation in the presence of internal wave • MC: mode coupling • AD: adiabatic • HR: horizontal refraction • HF: horizontal refraction and focusing [Katsnelson et al. 2007]
0 Acoustic track 310 08/17/2006 22:00 GMT Event # 50 270 90 180
Experimental set up • Research Vessel: R/V Sharp (blue) R/V Oceanus (red) • Acoustic source NRL 300Hz • Acoustic receiver array Shark VHLA • Temperature sensor array Sw45 (source) Sw20 (mid point) Sw54 (receiver)
Shark VHLA • 20.2 km south of the source • Vertical linear array (VLA) 16 hydrophones 3.5 m spacing 64 m of vertical aperture • Horizontal linear array (HLA) 32 hydrophones 15 m spacing 478 m of horizontal aperture
Following Rosey • Start : 18:00GMT, Aug 17 • Arrive at acoustic track: 21:40GMT • Clear out: 23:00GMT • End: 6:00GMT, Aug 18
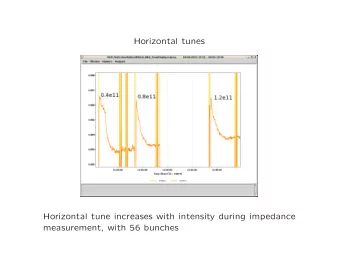
Temperature records • A sudden increase in the leading front thermocline depth shows the arrival of the ISW at the receiver (21:40), midpoint (22:02) and source (22:15). •Two acoustic signal transmission windows – Tg1 (20:30 to 20:37 GMT) : no ISW – Tg2 (22:00 to 22:07 GMT): ISW occupied most of the acoustic track .
Received signal on the vertical and horizontal array Tg1 Tg2
Received signal on the vertical and horizontal array
• Total intensity integrated over the depth H : H ∫ = I ( T ) I ( z , T ) dz 0 τ + ∆ τ 1 ∫ = 2 where : the intensity of I ( z , T ) p ( z , T , t ) dt ρ c τ the signal arrivals integrated over the pulse length Δτ . z : depth z, p : acoustic pressure ρ : water density c : sound speed.
NRL300 Zone 3 22:10-22:30 Zone 4 22:40-23:00 Zone 5 Zone 2 23:10-23:30 21:41-22:01 Zone 1 21:10-21:30 Shark array
NRL300 Hz Source Zone 3 22:10-22:30 Zone 4 22:40-23:00 Zone 5 Zone 2 23:10-23:30 21:41-22:01 Zone 1 21:10-21:30 Shark array
3 4 1 2
Zone 2 Zone 1 Zone 3 Zone 4 Zone 5
Summary • High quality acoustic and environmental data were collected during SW06 experiment. • Acoustic data, observations of radar images and temperature records show that during the passage of an ISW event, horizontal refraction results in significant acoustic intensity variation. • Observation agrees with the previous theory [Katsnelson, Lynch, Badiey et al. 2005, 2007, 2008]. • Future work includes mode and frequency filtering of acoustic data and modeling to establish the transition of acoustic field in the presence of ISW.
Recommend


More recommend
Explore More Topics
Stay informed with curated content and fresh updates.