Integrating I/O Measurement into Performance Optimisation and - PowerPoint PPT Presentation
Integrating I/O Measurement into Performance Optimisation and Productivity (POP) Metrics PDSW 2019: 4TH INTERNATIONAL PARALLEL DATA SYSTEMS WORKSHOP Background What is POP? Center of Excellence that provides service to analyze parallel codes
Integrating I/O Measurement into Performance Optimisation and Productivity (POP) Metrics PDSW 2019: 4TH INTERNATIONAL PARALLEL DATA SYSTEMS WORKSHOP
Background • What is POP? Center of Excellence that provides service to analyze parallel codes for academia and industry within the European Union to promote best practice in parallel programming. The goal of the current POP metrics is to sort out components affecting performance in a way to make it easy to read and understand • Unfortunately… I/O was not considered inside this model yet Integrating I/O Measurement into Performance Optimisation and Productivity (POP) Metrics 2 PDSW 2019: 4TH INTERNATIONAL PARALLEL DATA SYSTEMS WORKSHOP Radita Liem
Methodology Integrating I/O Measurement into Performance Optimisation and Productivity (POP) Metrics 3 PDSW 2019: 4TH INTERNATIONAL PARALLEL DATA SYSTEMS WORKSHOP Radita Liem
Current Impact on I/O Metrics with Collective IO Buffering (1) Load Balance 100% 90% 80% 70% 60% 50% 40% 30% 20% 10% 0% 4 9 16 Lustre - Skylake NFS Lustre - Broadwell BeeGFS Integrating I/O Measurement into Performance Optimisation and Productivity (POP) Metrics 4 PDSW 2019: 4TH INTERNATIONAL PARALLEL DATA SYSTEMS WORKSHOP Radita Liem
Current Impact on I/O Metrics with Collective IO Buffering (2) Transfer Efficiency 100% 90% 80% 70% 60% 50% 40% 30% 20% 10% 0% 4 9 16 Lustre - Skylake NFS Lustre - Broadwell BeeGFS Integrating I/O Measurement into Performance Optimisation and Productivity (POP) Metrics 5 PDSW 2019: 4TH INTERNATIONAL PARALLEL DATA SYSTEMS WORKSHOP Radita Liem
Current Impact on I/O Metrics with Collective IO Buffering (3) Serialization Efficiency 100% 90% 80% 70% 60% 50% 40% 30% 20% 10% 0% 4 9 16 Lustre - Skylake NFS Lustre - Broadwell BeeGFS Integrating I/O Measurement into Performance Optimisation and Productivity (POP) Metrics 6 PDSW 2019: 4TH INTERNATIONAL PARALLEL DATA SYSTEMS WORKSHOP Radita Liem
Current Impact on I/O Metrics with Collective IO Buffering (4) General Efficiency 150% 130% 110% 90% 70% 50% 30% 10% -10% 4 9 16 Lustre - Skylake NFS Lustre - Broadwell BeeGFS Integrating I/O Measurement into Performance Optimisation and Productivity (POP) Metrics 7 PDSW 2019: 4TH INTERNATIONAL PARALLEL DATA SYSTEMS WORKSHOP Radita Liem
Initial Conculsion & Next Steps • For MPI-IO with collective buffering case, the file systems difference appears on serialization efficiency this is due to: − I/O time is not evaluated on the ideal situation where I/O transfer rate is not a problem • Performing more tests on various applications with different I/O size and pattern. • Evaluating tools and methodologies to generate information that can represent the new I/O metric Integrating I/O Measurement into Performance Optimisation and Productivity (POP) Metrics 8 PDSW 2019: 4TH INTERNATIONAL PARALLEL DATA SYSTEMS WORKSHOP Radita Liem
Addendum Additional result & Information
Darshan I/O result for NAS Parallel Benchmark (1) NPB-IO Runtime (s) - Lustre filesystems both on Skylake 100 & Broadwell has higher transfer 80 rate than the other filesystem. 60 40 - This contributes to smaller runtime 20 compared to the other filesystems. 0 1 4 9 16 - We can also see the impact on the NFS - Broadwell NFS - Skylake Lustre - Skylake Lustre - Broadwell BeeGFS - Broadwell compute cluster where Intel Skylake faster runtime NPB-IO Transfer Rate (MiB/s) 1000 800 600 400 200 0 1 4 9 16 NFS - Broadwell NFS - Skylake Lustre - Skylake Lustre - Broadwell BeeGFS - Broadwell Integrating I/O Measurement into Performance Optimisation and Productivity (POP) Metrics 10 PDSW 2019: 4TH INTERNATIONAL PARALLEL DATA SYSTEMS WORKSHOP Radita Liem
Darshan I/O result for NAS Parallel Benchmark (2) NPB-IO Cummulative time in shared write NPB-IO Cummulative time in shared read (s) (s) 4 4 3 3 2 2 1 1 0 0 1 4 9 16 1 4 9 16 NFS - Broadwell NFS - Skylake NFS - Broadwell NFS - Skylake Lustre - Skylake Lustre - Broadwell Lustre - Skylake Lustre - Broadwell BeeGFS - Broadwell BeeGFS - Broadwell NPB-IO Shared Read Proportion NFS - Broadwell NFS - Skylake Lustre - Skylake • Lustre shows good performance on Lustre - Broadwell BeeGFS - Broadwell 91% 90% reading file and not for writing 88% 88% 87% 84% 83% 76% • BeeGFS shows balanced proportion for 50% 50% 50% 49% both read and write 26% 24% 24% 24% 22% 22% 13% 10% 1 4 9 16 Integrating I/O Measurement into Performance Optimisation and Productivity (POP) Metrics 11 PDSW 2019: 4TH INTERNATIONAL PARALLEL DATA SYSTEMS WORKSHOP Radita Liem
CalculiX I/O result for NAS Parallel Benchmark (1) - Good efficiency based on POP metrics CalculiX Runtime in Seconds - Lustre filesystem in the $HPCWORK 1000 performs worse than the other filesystem 800 performance. Initial hypotheses: POSIX 600 data transfer is mainly for writing and 400 200 Lustry shared write performance is 0 slower 1 2 4 8 $WORK - login-t $WORK $HPCWORK CalculiX POSIX transfer speed CalculiX STDIO transfer speed 35 400 350 30 300 25 250 20 200 15 150 10 100 5 50 0 0 1 2 4 8 1 2 4 8 $WORK - login-t $WORK $HPCWORK $WORK - login-t $WORK $HPCWORK Integrating I/O Measurement into Performance Optimisation and Productivity (POP) Metrics 12 PDSW 2019: 4TH INTERNATIONAL PARALLEL DATA SYSTEMS WORKSHOP Radita Liem
CalculiX I/O result for NAS Parallel Benchmark (2) Shared reads cummulative I/O Shared writes cummulative I/O 1.4 140 1.2 120 1 100 0.8 80 0.6 60 0.4 40 0.2 20 0 0 1 2 4 8 1 2 4 8 $WORK - login-t $WORK $HPCWORK $WORK - login-t $WORK $HPCWORK SHARED WRITE - Lustre performs badly doing file writing PROPORTION and CalculiX program creates and writes $WORK - login-t $WORK $HPCWORK into 5 files continuously 99.55% 99.32% 99.28% 99.34% 97.92% 97.74% 97.27% - This is the case when the filesystem type 96.60% 96.00% 95.86% affects the performance. In runtime result 93.87% 93.16% on the previous slide we can see that $HPCWORK result is the slowest among all three 1 2 3 4 Integrating I/O Measurement into Performance Optimisation and Productivity (POP) Metrics 13 PDSW 2019: 4TH INTERNATIONAL PARALLEL DATA SYSTEMS WORKSHOP Radita Liem
Background • Increased importance of the I/O optimization of the HPC application. • The topic is challenging due to various moving variables that make measurement difficult. − Measuring I/O computation time within shared file systems needs to consider cluster workloads, filesystem type, and the chosen programming model • POP is a Center of Excellence that provides service to analyze parallel codes for academia and industry within the European Union to promote best practice in parallel programming. • The goal of the current POP metrics is to sort out components affecting performance in a way to make it easy to read and understand. The new I/O performance metrics should conform to this model Integrating I/O Measurement into Performance Optimisation and Productivity (POP) Metrics 14 PDSW 2019: 4TH INTERNATIONAL PARALLEL DATA SYSTEMS WORKSHOP Radita Liem
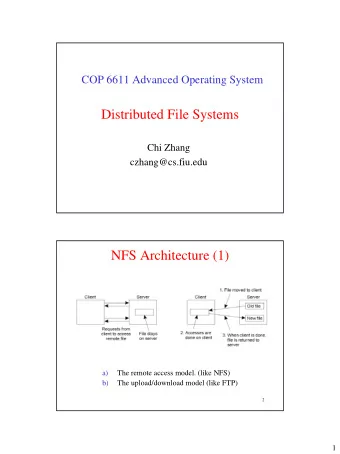
POP Metrics Explanation • General Efficiency Metric Compound metric from parallel efficiency * computation efficiency • Parallel Efficiency compound metrics from load balance * communication efficiency Load Balance: average computation time / maximum computation time Communication Efficiency: maximum computation time / total runtime • Serialization Efficiency: maximum computation time on ideal network / total runtime on ideal network • Transfer Efficiency: total runtime on ideal network / total runtime on real network • Computation Efficiency ratios of total time in useful computation summed over all processes. Source: https://pop-coe.eu/node/69 Integrating I/O Measurement into Performance Optimisation and Productivity (POP) Metrics 15 PDSW 2019: 4TH INTERNATIONAL PARALLEL DATA SYSTEMS WORKSHOP Radita Liem
Test Case Environment Software Information: • NAS Parallel Benchmark − Subtype full: MPI I/O with collective buffering − Size A, B, C − Compiled with Intel compiler 2018.4 • CalculiX − Open source finite state element analysis application − POSIX I/O − Compiled with Intel compiler 2018.4 Hardware: • RWTH Aachen University CLAIX18 compute cluster − Intel Skylake − Filesystems: NFS, Lustre • RWTH Aachen University CLAIX16 compute cluster − Intel Broadwell − Filesystems: NFS, Lustre, BeeGFS Integrating I/O Measurement into Performance Optimisation and Productivity (POP) Metrics 16 PDSW 2019: 4TH INTERNATIONAL PARALLEL DATA SYSTEMS WORKSHOP Radita Liem
Current Impact on I/O Metrics (1) Load Balance - Class A Load Balance - Class B Load Balance - Class C 100% 100% 100% 80% 80% 80% 60% 60% 60% 40% 40% 40% 20% 20% 20% 0% 0% 0% 4 9 16 4 9 16 4 9 16 Lustre - Skylake NFS Lustre - Skylake NFS Lustre - Skylake NFS Lustre - Broadwell BeeGFS Lustre - Broadwell BeeGFS Lustre - Broadwell BeeGFS Integrating I/O Measurement into Performance Optimisation and Productivity (POP) Metrics 17 PDSW 2019: 4TH INTERNATIONAL PARALLEL DATA SYSTEMS WORKSHOP Radita Liem
Recommend
More recommend
Explore More Topics
Stay informed with curated content and fresh updates.
