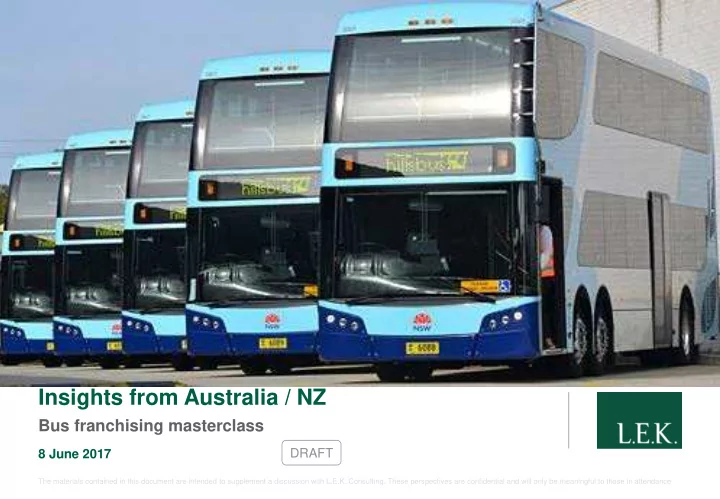

Insights from Australia / NZ Bus franchising masterclass DRAFT 8 June 2017 The materials contained in this document are intended to supplement a discussion with L.E.K. Consulting. These perspectives are confidential and will only be meaningful to those in attendance
Orientation 2.2m 1.9m 4.6`m 1.3m 1.2m 4.2m 0.3m 0.16m 1 CONFIDENTIAL | DRAFT
Agenda 2 CONFIDENTIAL | DRAFT
Agenda 3 CONFIDENTIAL | DRAFT
Agenda 600 Heavy rail 537m 510m Light rail* 3% 500 Bus 24% Ferry Millions of journeys p.a 400 41% 33% 300 1% 200 176m 4% 148m 55% 43% 67% 57% 100 50m 18m 43% 79% 8m 28% 5m 5% 16% 0 Melbourne Sydney Brisbane Perth Adelaide Canberra Hobart** Darwin* Source: Company and government annual reports and websites 4 CONFIDENTIAL | DRAFT
Public v private buses Passenger boardings by mode of transport and ownership in major cities (2010) 100% 90% 80% 70% 60% 50% 40% 30% 20% 10% 0% Melbourne Adelaide Perth Brisbane Sydney Private Rail Light Private Rail Private Buses Private Tram Private Ferries Public Rail Public Buses Public Tram Public Ferries Source: Company and government annual reports and websites 5 CONFIDENTIAL | DRAFT
6 CONFIDENTIAL | DRAFT
Agenda 7 CONFIDENTIAL | DRAFT
Reference materials 8 CONFIDENTIAL | DRAFT
Best practices Term Scale Scope Depots Performance Fleet Tendering Risk allocation regime Payment mechanism Operator concentration Tender evaluation 9 CONFIDENTIAL | DRAFT
Most interesting transitions Perth Adelaide Melbourne 2012/13 2004 Sydney Brisbane 2007- Auckland 2015 10 CONFIDENTIAL | DRAFT
Sydney 2004 - Critical ingredients Strong Financial leadership distress Broken “Carrot funding and stick” model Public Collaboration / report (ex- negotiated Premier) agreements 11 CONFIDENTIAL | DRAFT
Sydney - 2004 Before After 12 CONFIDENTIAL | DRAFT
Sydney – 2012/13 The good news 11 private contracts tendered - First time subject to true competition 4 new contracts awarded $45m pa saving over 10 years New customer performance regime The bad news Only one new entrant - Three other contracts all went to operators in adjacent areas Depots a significant barrier to effective competition 13 CONFIDENTIAL | DRAFT
Exports we are not that proud of 14 CONFIDENTIAL | DRAFT
NZ: From an effectiveness perspective, the model appeared to have several major shortcomings, but some good features Positive features appear to be: - operators that are strongly motivated to grow patronage - operators have some degree of freedom to implement changes and service innovation without a long / difficult evaluation process by public authorities Shortcomings include: - creation of a poor environment for implementing service changes and collaborative service planning - significant constraints on the ability of public authorities to implement integrated fares and ticketing - insufficient transparency of service quality factors (which have a material influence on patronage) - incidents of abrupt service suspension, through withdrawal of commercial services - disincentives for authorities to increase fares or service levels, due to revenue risk residing with operators There is a marked lack of consensus between Regional Councils and Operators about these shortcomings I:\Active\LTN1\Presentations\Departmental Briefing 060308 v05.ppt 15 CONFIDENTIAL | DRAFT
Analysis revealed a substantial cross-subsidy with low profits on commercial services and higher returns on contracted services ILLUS USTRA RATIVE Contracted Services Combined Commercial and Concession Contracted Services Top-up Millions of (Example NZ City) Dollars Millions EBIT margin: High of Dollars Contracted Payments Farebox Revenue Concession (Commercial) Top-up (Commercial) Farebox Concession EBIT OPEX Top-up Revenue (Contracted) Contract Payments Commercial Services Fare- EBIT margin: Low Box (Contract) Millions of Dollars Farebox OPEX* EBIT Concession Revenue Revenue Top-up OPEX EBIT Revenue Commercial Services EBIT = Earnings before interest and tax Contracted Services I:\Active\LTN1\Presentations\Departmental Briefing 060308 v05.ppt 16 16 CONFIDENTIAL | DRAFT
NZ: Both legislation and procurement procedures required substantial change Short Poor information Net contracts contracts on patronage High bid Small risk contracts for new entrants New entrants hesitant The two-tier system appears to be a key enabler of high Low number of contract prices “sizable” competitors in market Low number Lack of of bids Cross-subsidy performance Impact transparency High contract prices Relatively high operator margins 17 17 CONFIDENTIAL | DRAFT
NZ: PTOM implementation (2006- 2015) 18 CONFIDENTIAL | DRAFT
Chess board 19 CONFIDENTIAL | DRAFT
Your L.E.K. team Option A Simon Barrett Monica Ryu Jonathan Metcalfe Partner, Sydney Partner, Sydney Senior Advisor, Melbourne (Formerly CEO Transdev Aust/NZ) Areas of expertise Areas of expertise Areas of expertise Surface transport Public transport Public transport Rail and bus franchising Franchising Franchising Education Education Education BSc (Hons) Melbourne MA Harvard PhD Cambridge Simon Barrett Monica Ryu Jonathan Metcalfe John Goddard Andrew Allum Jonathan Simmons Partner, London Partner, London Partner, London Areas of expertise Areas of expertise Areas of expertise Public transport Public transport Public transport Franchising Franchising Bus operations Education Education Education Imperial College Imperial College Queens College, Cambridge Massachusetts Institute University of Oxford Harvard Business School of Technology John Goddard Andrew Allum Jonathan Simmons 20 CONFIDENTIAL | DRAFT
Recommend
More recommend