
SLIDE 1
Infrared
Infrared Earth emitted spectra overlaid on Planck function envelopes - - PowerPoint PPT Presentation
Infrared Earth emitted spectra overlaid on Planck function envelopes The special area in the vicinity of 3 and 4 microns A close-up view around 3.9 mm, with radiance at 100%, 50% and 20% for the 6000 K source 73 The special area between 3 and
Infrared
Earth emitted spectra overlaid on Planck function envelopes The special area in the vicinity of 3 and 4 microns
73
A close-up view around 3.9 mm, with radiance at 100%, 50% and 20% for the 6000 K source The special area between 3 and 4 microns
– Night-time Fog, Stratus & Cirrus – Super-cooled Clouds – Fog, Ice & Water Clouds Over Snow – Winter Storms – Land- and Sea-surface Temperatures – Thin Cirrus & Multi-layered Clouds – Urban Heat "Islands" – Fire Detection – Sun Glint – Cumulus Bands at Night – Convective Cloud Phases – Volcanic Ash Cloud Monitoring
Scattering from water versus ice particles at 3.9 microns Response of 3.9 vs. 10.7 microns to Temperature variability in a FOV
Display and analysis of imagery at short 3.9 microns. Visible loop (left) and 3.9 micron reflective component loop (right) from GOES-West (aspect ratio not 1:1) Click on images to start and stop animations. A B C D
On the left is an example of the difference in temperature measured at 3.9 and 10.7 microns for a partially filled field of view (FOV) for nighttime when there is no solar reflection. In this example, the hot-area is at 500 K and the remainder of the pixel is at 300 K.
A look at fires over Brazil This image and the next two are from GOES-16 and are the 0.64 micron channel
Zooming in on the scene
Zooming in even more
Fires show up as bright in this 3.9 micron channel image. This is because it is displayed in a reflective mode, not an emissive mode.
This image is from the 2.2 micron channel. While you see no smoke, there are some thermal signatures from some of the more intense fires.
Water vapor absorption
GOES-9 6.7 micron infrared (water vapor channel) movie loop: a broadband channel that extends from 6.47 to 7.02 microns
With GOES-12 the broadband water vapor channel spectral rage was increased to span the interval 5.8 to 7.3 microns
Let’s compare the three water vapor channels
geostationary satellites
High level H20 vapor
Middle level H20 vapor
Low level H20 vapor
Air- mass product made using the three water vapor channels
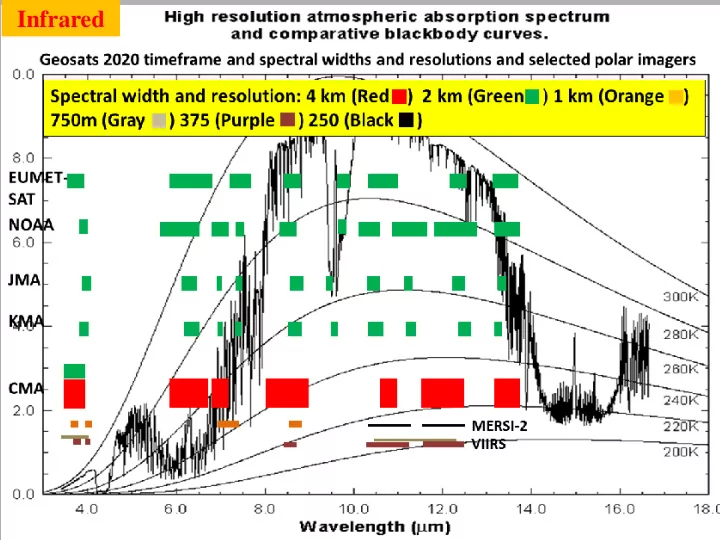
Earth emitted spectra overlaid on Planck function envelopes
MODIS VIIRS ABI
MSG
GOES 8/11 GOES 12/P
The infrared window regions and ozone absorption area
Comparison of visible and infrared imagery from GOES-15 and JPSS Polar
IR is 2 km resolution while Polar is 375
is 500 vs 375 (JPSS) meters These images are of large severe thunderstorms and were taken within 30 seconds of one another.
AVHRR Sea surface Temperature product produced by CoastWatch. This picture is over he Atlantic Ocean off of the East Coast of the United States. Notice the strong temperature gradient across the boundary of the Gulf Stream and warm eddies that have broken off and migrated into the colder waters.
109
AVHRR Sea Surface temperature Anomalies (Deg. C) November 1996 vs November 1997
110
AVHRR Sea Surface temperature Anomalies (Deg. C) November 1996 vs November 1997
Investigating with Multi-spectral Combinations Given the spectral response
feature Select a part of the spectrum where the reflectance or absorption changes with wavelength METEOSAT movie of large dust storm over Africa If 12 μm sees considerably higher BT than 11 μm then the atmosphere probably contains dust (as above) or volcanic ash; if 11 μm sees the same
atmosphere viewed does not contain dust cloud or volcanic ash; trans 11.5 μm
11 μm 12 μm Volcanic Ash Or dust cloud
transmission (total) transmission (scattering) transmission (absorption) 0.1 0.2 0.3 0.4 0.5 0.6 0.7 0.8 0.9 1 transmission
4 5 Ash
AVHRR channels
absorption scattering total 9 10 11 12 13 14 wavelength
False color images from MSG channels. Left: 12.0-10.8 (R), 10.8-8.7 (G), 10.7 (B). Right: 1.6 (R), 0.8 (G), 0.6 (B). Click on either image to view animation.
METEOSAT-8 (MSG) detection of large dust storm over Africa using visible to near IR (right) and IR (left) channel combinations
Image of hurricane Florence which produced massive flooding along the USA East Coast State of North Carolina
. . This is before Florence arrival. Note no ocean sediment.
This is after Florence arrival. Note ocean sediment.
VIIRS composite image from 11:39 AM, September 19, 2018 Ocean sediment very apparent.
Animation of GOES-16 from September 19, 2018 using CIRA Geo-color product.
65,535 ways to “combine” 16 channels
120
560
1820
4368
8008
11440
12870
11440
1
16 channel imagers offer the possibility of 65,535 ways to combine those channels (number includes using each independently). From Geostationary Orbit possibilities exist every 5 to 10 minutes with full disc imagery and at times over limited areas with imagery as frequently as one to two minutes (special events). Numerous product areas, such as precipitation estimation, cloud motion vector derivation, feature tracking, severe storm identification and nowcasting will benefit from this new generation of geostationary satellite data, but only with a strong emphasis on advanced analysis methods, and in many cases in synergy with other types of satellite data
Features of Principal Component Imagery (PCI)
(this work based on research of Don Hillger, RAMM team, NOAA/NESDIS, CIRA, Colorado State University)
True color image over Bohai Bay, Tianjin, Beijing and North East China – note
We’ll analyze this case with VIIRS imagery. We’ll look at a Himawari example after this.
13 VIIRS Channels Used in 12 August 2015 Tianjin Analysis
McIDAS Central
Band Wavelength
M01 0.412 um
M02 0.445 um
M03 0.488 um
M04 0.555 um
M05 0.672 um
M06 0.746 um not used bad striping
M07 0.865 um
M08 1.240 um
M09 1.378 um not used very noisy
M10 1.610 um
M11 2.250 um
M12 3.700 um
M13 4.050 um not used no data
M14 8.550 um
M15 10.763 um
M16 12.013 um
12 of the 13 VIIRS Channels Used for this Case
Closer View of 6 of the 13 VIIRS Channels Used for this Case: illustrates scattering at shorter wavelengths and some properties of 0.67 vs 0.86 (water and vegetation and scattering) and of 3.7 vs 10.7 (distinct heat islands)
0.412 um 0.445 um 0.488 um 0.555 um 0.672 um 0.865 um 1.240 um 1.610 um 2.250 um 3.700 um 8.550 um 10.76 um 12.01 um
First Principal Component Image from the 13 Channels of VIIRS imagery. Common and redundant information into lower
Note land and water darkness dominate
Second Principal Component Image from the 13 Channels of VIIRS imagery. Common and redundant information into lower
Note haze and cloud features dominate
0.412 um 0.445 um 0.488 um 0.555 um 0.672 um 0.865 um 1.240 um 1.610 um 2.250 um 3.700 um 8.550 um 10.76 um 12.01 um
Third Principal Component Image from the 13 Channels of VIIRS imagery. Common and redundant information into lower
Note contributio n from 0.86 and IR, particularly 3.7
0.412 um 0.445 um 0.488 um 0.555 um 0.672 um 0.865 um 1.240 um 1.610 um 2.250 um 3.700 um 8.550 um 10.76 um 12.01 um
Sixth Principal Component Image from the 13 Channels of VIIRS imagery. Common and redundant information into lower
difference information into higher
Note the coastal waters
0.412 um 0.445 um 0.488 um 0.555 um 0.672 um 0.865 um 1.240 um 1.610 um 2.250 um 3.700 um 8.550 um 10.76 um 12.01 um
Ninth Principal Component Image from the 13 Channels of VIIRS imagery. Difference information into higher
Note the coastal waters
0.412 um 0.445 um 0.488 um 0.555 um 0.672 um 0.865 um 1.240 um 1.610 um 2.250 um 3.700 um 8.550 um 10.76 um 12.01 um
Eleventh Principal Component Image from the 13 Channels of VIIRS imagery. Common and redundant information into lower
difference information into higher
Note the near coastal region
0.412 um 0.445 um 0.488 um 0.555 um 0.672 um 0.865 um 1.240 um 1.610 um 2.250 um 3.700 um 8.550 um 10.76 um 12.01 um
RGB image made from PCI’s 6 (lower left), 9 (lower center) 11 (bottom right) made to emphasize coastal land and water areas
Advanced Himawari Imager Examples
Dust storm
Himawari-8 at 10 minute intervals;
Himawari - 8