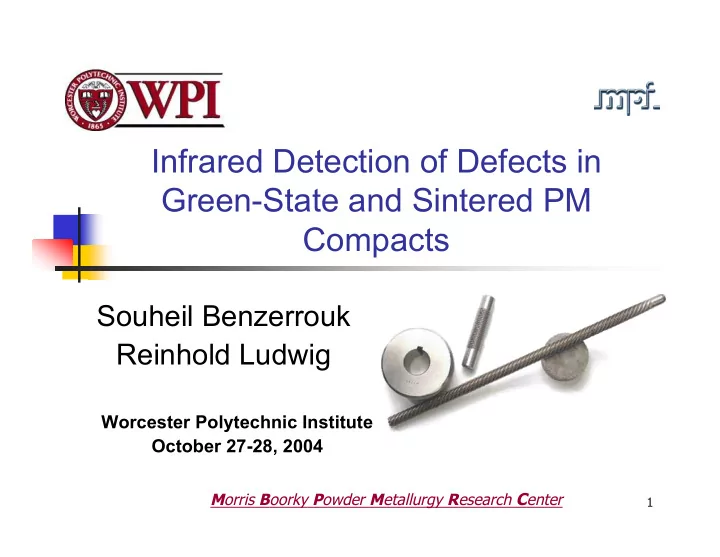

Infrared Detection of Defects in Green-State and Sintered PM Compacts Souheil Benzerrouk Reinhold Ludwig Worcester Polytechnic Institute October 27-28, 2004 M orris B oorky P owder M etallurgy R esearch C enter 1
A warm Welcome from Prof. Ludwig 2
Research Objectives Evaluate the feasibility of IR imaging for the detection of surface and subsurface defects in P/M parts Establish a full dynamic thermo-electric IR solution that allows the testing of both green state and sintered P/M parts Estimate experimentally effects from equipment radiation in a manufacturing environment 3
Research Approach Establish the necessary background in the fields of radiation, imaging and detection Construct a dynamic test bed to test for subsurface defects Test Controlled samples with subsurface defects Process evaluation through on-line testing of P/M parts 4
Outline IR imaging: sources of radiation Test Arrangement Experimental study: subsurface defects imaging and data processing Experimental Study: on-line testing of green state parts Accomplishments Future work 5
IR imaging Signal processing computer DC power supply Incident radiation from the Sample surroundings under test Reflected radiation Contacts Emitted radiation Radiation from the IR camera surroundings Sources of radiation S S S S = + + Incident from the sample s r at Reflected Atmospheric 6 Generic Formulation
Test Arrangement DC Power supply Signal processing computer Motorized press DC power supply system GPIB An IR camera at Switch Firewire Function 0.3m away from the generator sample under test Sample under test Contacts A computer for IR camera processing and camera controls 7 Test Arrangement
Test Arrangement Control computer Press A switching circuit, system for pulse shaping Painted P/M part and synchronous DC Power IR camera operation supply Switching circuit 8 Test Arrangement
Subsurface Defects Part parameters: Green state part with pure iron: 1000B Current No lubrication step Defect: Location:2 mm from the surface, 2.5 cm from the top 1 mm hole 9 Experimental Results
Subsurface Defects: Processing 10 Experimental Results
Subsurface Defects: Processing Spot Temperature Over Time 303.4 Signature from the subsurface defect 303.2 303 Temperature (Kelvin) 302.8 302.6 302.4 302.2 302 0 5 10 15 20 11 Experimental Results
Transient Model: Reminder t =0.2 sec Current step t =1 sec 12 2D Study and Sensitivity Estimation
Transient Model: Reminder Surface and subsurface defects are easily detected Fast response, very efficient, suitable for a go/no go test Highly sensitive, reduced post-processing complexity Camera requirements include: Dynamic range: 2 Hz Thermal sensitivity: 0.2 0 C 13 2D Study and Sensitivity Estimation
Subsurface Defects: New Samples Parts courtesy of Nichols Portland Part Parameters: Density: 7.2 g/cc Material: FC0205 Lubricant: 0.55% EBS Embedded Defects: Material: Glass bead Size: 0.8mm 14 Experimental Results
Subsurface Defects: New Samples Parts courtesy of Nichols Portland 15 Experimental Results
Subsurface Defects: Discussion Method successful in the detection of subsurface defects Thermal signature is dependent on defect size, shape, orientation and distance from the surface: Diffusion Smaller defects or deeply imbedded defects (distance from the surface is greater than the size of the defect) require a stable background and a sensitive detector 16 Experimental Results
On-Line Testing Requirements: Fast response High spatial resolution High temperature range High image recording rate Benefits: Allows 100% testing Provides real time feedback on part quality and process repeatability 17 Experimental Results
On-Line Testing Part Constituents: FLC-4608 0.9% graphite content 0.75% KENOLUBE P-11 Lubricant Manufacturing rate: 500parts/hour Parts courtesy of GKN Worcester 18 Experimental Results
On-Line Testing Setup courtesy of GKN Worcester 19 Experimental Results
On-Line Testing: Processing Processing of individual parts Profiles have very similar shapes Some difference due to Part1 having a different angle when manufactured 20 Experimental Results
On-Line Testing: Processing 345 340 Temperature (Degree K) 335 330 325 320 315 310 305 300 0 5 10 15 20 25 30 35 Time (sec) Monitoring the temperature of a spot in the production line 21 Experimental Results
On-Line Testing: Processing 345 340 335 330 Temperature (Degree K) 325 320 315 310 305 300 1 1.2 1.4 1.6 1.8 2 2.2 Time (sec) Monitoring the temperature of a spot in the production line and zooming in one part 22 Experimental Results
On-Line Testing: Discussion After processing valuable information about the part integrity and quality is available in real time Process variations causing density gradients can be flagged Part orientation in the line can be detected Easy to implement with low cost and space overhead 23 Experimental Results
Accomplishments Developed an analytical foundation of heating with direct current (electrostatics and heat transfer) and IR detection Built a suitable model for predicting the thermal profile on the surface of a part ( close to what the IR camera will capture) Conducted simple dynamic testing of controlled samples with subsurface defects Conducted on-line testing of simple parts 24 Accomplishments
Future Work Experimental measurements (Controlled samples) Different powder mixture Different compaction densities Different lubricants and concentrations Glass and plastic inserts to simulate subsurface defects Instrumentation efforts Current strength and pulse shape Injection methods Post processing options Include in the numerical model Radiation computations Density variation and non-uniformity Contact resistance (material parameters) 25 Future Work
Questions 26
Questions 27
Recommend
More recommend