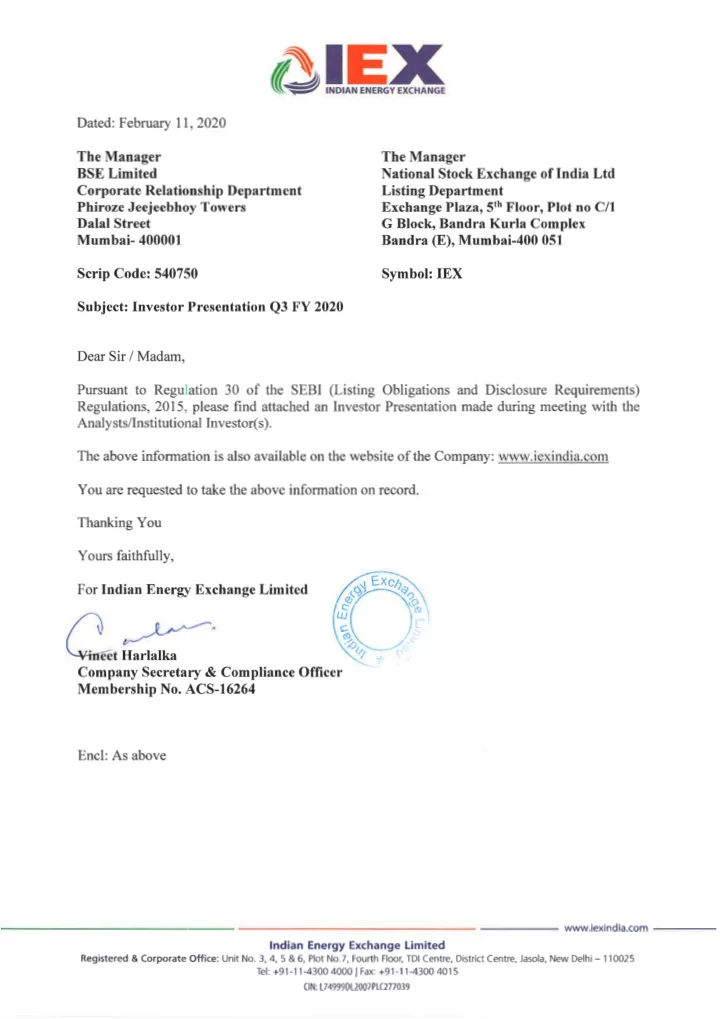
IEX INDIAN ENERGY EXCHANGE Dated: February 11, 2020 The Manager The Manager BSE Limited National Stock Exchange of India Ltd Corporate Relationship Department Listing Department Phiroze Jeejeebhoy Towers Exchange Plaza, 5 th Floor, Plot no C/1 Dalal Street G Block, Bandra Kurla Complex Mumbai- 400001 Bandra (E), Mumbai-400 051 Scrip Code: 540750 Symbol: IEX Subject: Investor Presentation Q3 FY 2020 Dear Sir / Madam, Pursuant to Regulation 30 of the SEBI (Listing Obligations and Disclosure Requirements) Regulations, 2015. please find attached an Investor Presentation made during meeting with the Analysts/Institutional Investor(s). The above information is also available on the website of the Company: www.iexindia.com You are requested to take the above information on record. Thanking You Yours faithfully, For Indian Energy Exchange Limited Vineet Harlalka Company Secretary & Compliance Officer Membership No. ACS-16264 End: As above www.iexindia.com Indian Energy Exchange Limited Registered & Corporate Office: Unit No. 3, 4, 5 & 6, Plot No.7, Fourth Floor, TDI Centre, District Centre, Jasola, New Delhi — 110025 Tel: +91-11-4300 4000 I Fax: +91-11-4300 4015 CIN: 1_74999DL2007PLC277039
Investor Presentation - Q3’20 For Public Use
IEX : Who we are Sector transformation In this presentation Electricity value chain & Power market structure Way forward
Who we are Nationwide automated platform providing a competitive and transparent • VISION marketplace for physical delivery of electricity • Commenced operations in 2008, CAGR 35%, CERC regulated Create marketplaces for efficient use of the energy resources • India’s leading power exchange, Market Share: 97% • Average daily trade 6000+ MW • Record day volume : 308 MU’s (12,900 MW) • Our customer base MISSION 4000+ Industries I 55 Discoms (all) I 100+ ESCert Entities To operate an energy marketplace that is 400+ Generators I 1500+ RE Generators & Obligated entities transparent, competitive and reliable, for • Publicly listed company (NSE and BSE) the benefit of all stakeholders • ISO 9001:2015, ISO 27001:2013, ISO 14001:2015
Benefitting Power Sector….and the nation • Provides benchmark prices for all electricity transactions • Transparent Mechanism for Price Discovery • High liquidity on exchange has ensured lowest cost and assured supply Truly benefited Indian Power Sector Transmission Distribution Generation • Investments in transmission - Lower power prices for Signals for Generating Capacity congestion free – One Grid One discoms, end consumers. addition (~35 GW Merchant plants) Price • Avoids buying under take-or- pay contracts. • Flexibility on 15-min basis
Robust financials & operational excellence Revenue Operating Cash Profit (In Rs Crore) Q3: 45.8 145 Q3: 69.4 85 133 121 74 H2 H2 59 H1 H1 95 149 148 90 123 68 112 58 FY17 FY18 FY19 H1FY20 FY17 FY18 FY19 H1FY20 EBITDA PAT 118 Q3: 56.7 H2 Q3: 41.2 110 80 92 H2 68 58 H1 125 123 88.4 H1 85 101 86 64 56 FY17 FY18 FY19 H1FY20 FY17 FY18 FY19 H1FY20 76% 82% 83% 83% 49% 52% 56% 60% * Q3’20 financials are consolidated to include financials of Indian Gas Exchange; wholly owned subsidiary of Indian Energy Ex change incorporated on November 06, 2019.
IEX : Who we are Sector transformation In this presentation Electricity value chain & Power market structure Way forward
Sector transformation drivers Deployment of low-carbon Small-scale generation across technologies - wind and solar. T&D network Decarbonization Decentralization Outlook: Outlook: • Renewables to become leading • RE a threat to centralized energy sources energy production • Emerging new tech like hybrids • Requirement of local solutions Intelligent CS and Apps to Empowered consumers - optimize plants and grid economic power shift Digitization Democratization Outlook: Outlook: • Digital Tech to promote • Peer to peer energy trading aggregation solutions Hybridization requires technology Paris Climate Agreement – Renewable energy to constitute 40% driven apps and automation of total installed capacity base of 1250 GW by 2030
IEX : Who we are Sector transformation In this presentation Electricity value chain & Power market structure Way forward
Electricity value chain CAGR (%) Share of REN* CAPACITY (GW) 344 356 369 305 327 23% 18.8% REN FY'16 FY'17 FY'18 FY'19 FY'20 (YTD Dec'20) 6.7% Thermal Nuclear Hydro RES GENERATION (BU) Generation Transmission Distribution Energy 1303 1372 1168 1236 10% 1048 De-licensed is licensed licensed deficit 24.4% YTD decreased Dec’20 FY'16 FY'17 FY'18 FY'19 FY'20 REN Private World’s largest Rs 88,795 Cr O/S* from 10% (YTD'20) sector ~46% network to 0.7% 5.5% Thermal Nuclear Hydro Renewables PEAK DD (GW) DISCOM losses over the Generation Pvt sector ~Rs.28,000 Cr last decade 1 190 in distress ~8% 176 183 1 180 AT&C Loss 1 170 1 157 160 148 0 161 150 0 • As of Dec 2019; CAGR till FY’19, calculated as 4 yr CAGR except for Generation (3 year CAGR) - 140 5.6% • Source: CEA; MOP 5 year vision; press FY'16 FY'17 FY'18 FY'19 FY'20 (YTD'20)
Power market structure Bilateral (BU) Short Term (10.6%) (3Yr CAGR: 8%; 1H’20: -1.7%) Long Term (89.4%) 1,372 BU (incl REN)* OTC: Exchanges: Up to 25 years Real Time Intraday to 1 year Intraday – 11 days -5.8% 67 56 -30.5% 55 57.5% 47 44 66.5 BU 25.1 BU 1,226.5 BU 53.5 BU 40 34 23 21 21 19 17 3.9% 89.4% 1.8% 4.9% Bilateral Direct Trader FY17 FY18 FY19 YTD Nov'20 Exchange (BU) DSM (BU) Exchanges (Only up to 11 Bilateral & days) Deviation ➢ DAC Banking settlement/ -5.6% Long-term PPA 54 ➢ Daily 47 Transactions Unscheduled 41 38 -3.9% ➢ Weekly Interchange 25 24 23 16 ➢ Day Ahead Market PXs DSM • As of FY’19; CAGR calculated for 3 years ending FY’19 FY17 FY18 FY19 YTD Nov'20 FY17 FY18 FY19 YTD Nov'20 • Source: CEA, CERC
Electricity consumption set to increase • India a third of global average in per capita consumption • Economic activity will accelerate • Government envisions India as a $5tn economy by FY’25 • Manufacturing contribution up from 15% to 25% • Core sector growth will drive electricity consumption • Rapid urbanization • 17 of 20 world’s fastest growing cities in India • Consumer demand growth • Last mile connectivity - Saubhagya : Power for All • Power on 24x7 basis 1 11
Markets have immense potential Per Capital Electricity Consumption (KWh) 2 • Electricity demand grew 5.6% in the last 3 years India’s per capita electricity demand is 1/3 rd global 12,994 • average; projected to increase 40% in next 5 years 7,035 6,940 6,603 • ~ 45 GW of PPA’s retiring in the next 8 years 3,927 3,127 2,601 1,181 • ~4.3 GW of PPA’s (LT and MT) expiring in the next 8 years US France Germany Russia Global China Brazil India Average Exchange market as a % of total demand – Global 4 Expected Electrical Energy Requirement (BU) 3 2,047 1,939 1,836 91% 1,740 1,651 1,566 1,483 1,400 49% 47% 39% 34% 23% 15% 4% 2019-20 2020-21 2021-22 2022-23 2023-24 2024-25 2025-26 2026-27 Source: 1. CERC; 2. World Bank; 3. CEA 4. CRISIL Study
IEX : Who we are Sector transformation In this presentation Electricity value chain & Power market structure Way forward
Way forward 1. Expand coverage and market • Launch new products • Advocacy to increase short term market 2. Best in class, futuristic Technology Infrastructure • Enterprise IT, trading platform • Technology & analytics solutions for customers 3. Strengthen the organisation • Capacity building, hi-performance culture • Talent acquisition, development and retention 4. Business diversification • Play in the energy (eg. - gas) basket of India • Energy efficiency technology solutions
Expand coverage and market New Product Launches Tech based • • Real time electricity market Smart Power Procurement • • Cross Border Trade Analytics • • Longer Duration Contracts New Product Development • Green TAM • Exchange based Ancillary Market • Gross Bidding Open Access + DISCOM Maximization
Technology in transformation Automated Digital • Digital Inside Manual Workflow • Open API integration Mesh • Robotic Process Automation Modular Digital • Service Oriented Architecture Monolithic • Automated Bank Integration Twins Desktop Based All Platforms • Web Based Portal • Trading App • Customer Survey Driven UX Intuitive System design Disparate System • Unified Risk Management • Proactive Alerts Configurable • Re-architecture Products Limited Products • Long Duration Contract, RTM • Product: GMEX, UTrade, • Product: GMEX, UTrade, Nagarro, Twilio, Nagarro, Twilio Partnerships In-House • System Design: Cap Gemini, • System Design: Cap Gemini, Development TCIL, Akamai TCIL, Akamai, • Automation Anywhere,UIPath, • Automation Anywhere, UIPath, Pentaho Pentaho
Recommend
More recommend
Unleash a World of Digital Possibilities—Browse, Share, and Explore Content Without Boundaries