Identifying Performance Bottlenecks in CDNs through TCP-Level - PowerPoint PPT Presentation
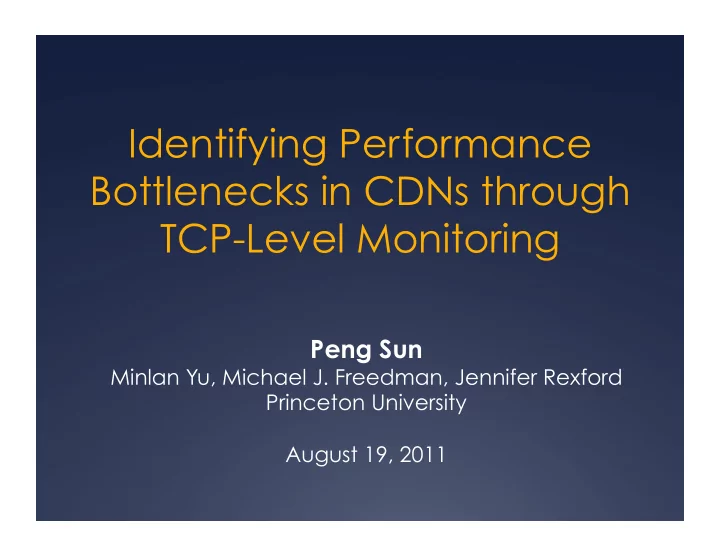
Identifying Performance Bottlenecks in CDNs through TCP-Level Monitoring Peng Sun Minlan Yu, Michael J. Freedman, Jennifer Rexford Princeton University August 19, 2011 Performance Bottlenecks CDN Servers Server APP Internet Clients
Identifying Performance Bottlenecks in CDNs through TCP-Level Monitoring Peng Sun Minlan Yu, Michael J. Freedman, Jennifer Rexford Princeton University August 19, 2011
Performance Bottlenecks CDN Servers Server APP Internet Clients Server OS APP Internet Client Write too slowly Network congestion Insufficient receive buffer Server OS Insufficient send buffer or Small initial congestion 2 window
Reaction to Each Bottleneck CDN Servers Server APP Internet Clients Server OS APP is bottleneck: Internet is bottleneck: Client is Debug application Circumvent the bottleneck: congested part of Notify client to network change Server OS is bottleneck: Tune buffer size, or upgrade server 3
Previous Techniques Not Enough Application logs: Packet sniffing: No details of network Expensive to capture activities Server APP Packet Server OS Sniffer Transport-layer stats: Directly reveal perf. Active probing: bottlenecks Extra load on network 4
How TCP Stats Reveal Bottlenecks Insufficient data in send buffer CDN Server Receive Applications window too Packet loss small Send buffer full or Initial congestion Server Clients Network Path window too small Network Stack CDN Servers Internet Clients 5
Measurement Framework • Collect TCP statistics • Web100 kernel patch • Extract useful TCP stats for analyzing perf. • Analysis tool • Bottleneck classifier for individual connections • Cross-connection correlation at AS level Map conn. to AS based on RouteView • Correlate bottlenecks to drive CDN decisions • 6
How Bottleneck Classifier Works 350 Rwin 300 Cwin BytesInSndBuf 250 200 KB Small initial Cwin BytesInSndBuf = Rwin Cwin drops greatly 150 and Packet loss Slow start limits perf. 100 Rwin limits sending Network path is 50 Network Stack is Client is bottleneck bottleneck bottleneck 0 0 1 2 3 4 5 6 7 8 9 10 11 12 13 14 15 16 17 18 Time in seconds 7
CoralCDN Experiment • CoralCDN serves 1 million clients per day • Experiment Environment • Deployment: A Clemson PlanetLab node • Polling interval: 50 ms • Traces to Show: Feb 19 th – 25 th 2011 • Total # of Conn.: 209K • After removing Cache-Miss Conn.: 137K (Total 2008 ASes) • Log Space overhead • < 200MB per Coral server per day 8
What are Major Bottleneck for Individual Clients ? • We calculate the fraction of time that the connection is under each bottleneck in lifetime % of Conn. With Bottleneck for Bottlenecks >40% of Lifetime Server Application 10.75% Server Network Stack 18.72% Network Path 3.94% Clients 1.27% Reasons: Reasons: Our suggestion: Reasons: Reasons: Our suggestion: Our suggestion: Congestion window rises too slowly for short conn. Filter them out of decision making Slow CPU or scarce disk resources of the PlanetLab node Spotty network (discussed in next slide) Receive buffer too small (Most of them are <30KB) Use more powerful PlanetLab machines Use larger initial congestion window (>80% of the connections last <1 second) 9
AS-Level Correlation • CDNs make decision at the AS level • e.g., change server selection for 1.1.1.0/24 • Explore at the AS level: • Filter out non-network bottlenecks • Whether network problems exist • Whether the problem is consistent 10
Filtering Out Non-Network Bottlenecks • CDNs change server selection if clients have low throughput • Non-network factors can limit throughput • 236 out of 505 low-throughput ASes limited by non-network bottlenecks • Filtering is helpful : • Don’t worry about things CDNs cannot control • Produce more accurate estimates of perf. 11
Network Problem at AS Level • CDN make decision at AS level • Whether conn. in the same AS have common network problem • For 7.1% of the ASes, half of conn. have >10% packet loss rate • Network problems are significant at the AS level 12
Consistent Packet Loss of AS • CDNs care about predictive value of measurement • Analyze the variance of average packet loss rates • Each epoch (1 min) has nonzero average loss rate • Loss rate is consistent across epochs (standard deviation < mean) # of ASes with Analysis Length Consistent Packet Loss One Week 377 / 2008 One Day (Feb 21 st ) 122 / 739 One Hour 19 / 121 (Feb 21 st 18:00~19:00) 13
Conclusion & Future Work • Use TCP-level stats to detect performance bottlenecks • Identify major bottlenecks for a production CDN • Discuss how to improve CDN’s operation with our tool • Future Works • Automatic and real-time analysis combined into CDN operation • Detect the problematic AS on the path • Combine TCP-level stats with application logs to debug online services 14
Thanks! Questions ? 15
Recommend
More recommend
Explore More Topics
Stay informed with curated content and fresh updates.
