Hypothesis testing Hypothesis tests are most often used to make a - PowerPoint PPT Presentation
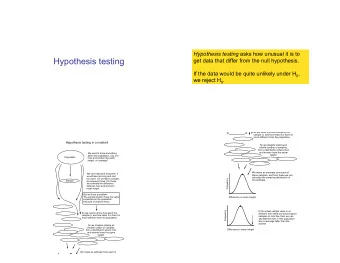
Hypothesis testing Hypothesis tests are most often used to make a statement about superiority, inferiority or equality of treatments. Confidence intervals do contain this information also, but the conclusion is a bit more difficult to extract.
Hypothesis testing Hypothesis tests are most often used to make a statement about superiority, inferiority or equality of treatments. Confidence intervals do contain this information also, but the conclusion is a bit more difficult to extract. The most difficult step in a hypothesis test is setting up the hypothesis. Thomas Jaki Statistical methods in health research
Innocent until proven guilty A hypothesis is a statement about a parameter of interest. The null, H 0 , and the alternative hypothesis, H A , are competing. The null hypothesis is the current believe. The alternative hypothesis reflects what you want to show. Thomas Jaki Statistical methods in health research
Example You developed a new migrane pill, you believe relieves more people than the currently used products. Extensive studies on the currently used products show that they help 55% of the patients with migrane. What should your hypothesis be? Thomas Jaki Statistical methods in health research
Hypothesis testing step by step State the null hypothesis . 1 Decide what test to use and check the assumptions of the 2 test. Calculate the test statistic . 3 Find the probability of observing the test statistic if the null 4 hypothesis is in fact true ( p -value ). Decide whether this is enough evidence to reject (or not 5 reject ) the null hypothesis. State the conclusions and interpretation of the results. 6 Thomas Jaki Statistical methods in health research
χ 2 -test - Example If you have 2 (categorized) variables that you believe are related a Chi-square ( χ 2 ) test can be used. A study at the University of Texas Southwestern Medical Center examined 626 people to see if there was an increased risk of contracting hepatitis C associated with having a tattoo. If the subject had a tattoo, researchers asked whether it had been done in a commercial tattoo parlor or elsewhere. Thomas Jaki Statistical methods in health research
Example - cont. Observed values Tatoo Hepatitis C Comm Parlor Elsewhere None Total Yes 17 8 18 43 No 35 53 495 583 Total 52 61 513 626 Thomas Jaki Statistical methods in health research
Example - cont. Expected values Tatoo Hepatitis C Comm Parlor Elsewhere None Total 43 ∗ 52 43 ∗ 61 Yes 626 = 3 . 57 626 = 4 . 19 35 . 24 43 583 ∗ 52 583 ∗ 61 No = 48 . 43 = 56 . 81 477 . 76 583 626 626 Total 52 61 513 626 Thomas Jaki Statistical methods in health research
Example - cont. ( observed − expected ) 2 X 2 = � expected cells χ 2 = (17 − 3 . 47) 2 + · · · + (495 − 477 . 76) 2 = 67 . 43 3 . 47 477 . 76 Thomas Jaki Statistical methods in health research
Example - cont. The degrees of freedom (df) are (# rows − 1)(# cols − 1) = (2 − 1)(3 − 1) = 2 From the χ 2 -calculator we find the the cut-off value for 99.9% is 13.82. Since this is much smaller than the calculated value, we can conclude that tatoos and hepatitis are related with 99.9% certainty. Thomas Jaki Statistical methods in health research
A confidence interval approach For a 2x2 table, we can also use a confidence interval to test for a difference. Observed values Tatoo Hepatitis C Yes No Total Yes 25 18 43 No 88 495 583 Total 113 513 626 Thomas Jaki Statistical methods in health research
A confidence interval approach - cont. p 1 = characteristic present group 1 = 25 ˆ 113 = 0 . 221 total group 1 p 2 = characteristic present group 2 = 18 ˆ 513 = 0 . 035 total group 2 Thomas Jaki Statistical methods in health research
A confidence interval approach - cont. ˆ d = p 1 − ˆ ˆ p 2 = 0 . 221 − 0 . 035 = 0 . 186 � p 1 (1 − ˆ ˆ p 1 ) + ˆ p 2 (1 − ˆ p 2 ) = SE n 1 n 2 � 0 . 221(1 − 0 . 221) + 0 . 035(1 − 0 . 035) = = 0 . 040 113 513 Thomas Jaki Statistical methods in health research
A confidence interval approach - cont. A 95% confidence interval then is: ( ˆ d − 2 ∗ SE, ˆ d + 2 ∗ SE ) (0 . 186 − 2 ∗ 0 . 040 , 0 . 186 + 2 ∗ 0 . 040) (0 . 106 , 0 . 266) Since zero is not included, we are at least 95% confident that there is a relationship between tattoos and hepatitis. Thomas Jaki Statistical methods in health research
Recommend


More recommend
Explore More Topics
Stay informed with curated content and fresh updates.