HPCToolkit: Performance Tools for Parallel Scientific Codes John - PowerPoint PPT Presentation
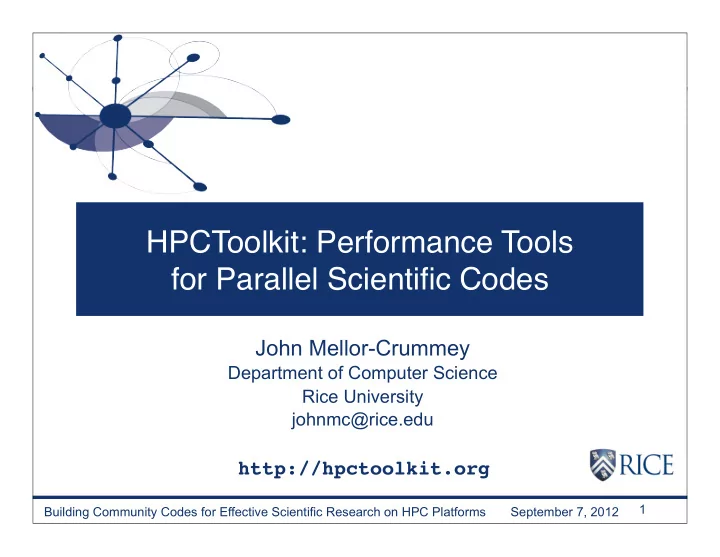
HPCToolkit: Performance Tools for Parallel Scientific Codes John Mellor-Crummey Department of Computer Science Rice University johnmc@rice.edu http://hpctoolkit.org 1 Building Community Codes for Effective Scientific Research on HPC
HPCToolkit: Performance Tools for Parallel Scientific Codes John Mellor-Crummey Department of Computer Science Rice University johnmc@rice.edu http://hpctoolkit.org 1 Building Community Codes for Effective Scientific Research on HPC Platforms September 7, 2012
Challenges for Computational Scientists • Execution environments and applications are rapidly evolving — architecture – rapidly changing multicore microprocessor designs – increasing scale of parallel systems – growing use of accelerators — applications – transition from MPI everywhere to threaded implementations – add additional scientific capabilities – maintain multiple variants or configurations • Computational scientists need to — assess weaknesses in algorithms and their implementations — improve scalability of executions within and across nodes — adapt to changes in emerging architectures Performance tools can play an important role as a guide 2
Performance Analysis Challenges • Complex architectures are hard to use efficiently — multi-level parallelism: multi-core, ILP, SIMD instructions — multi-level memory hierarchy — result: gap between typical and peak performance is huge • Complex applications present challenges — measurement and analysis — understanding behaviors and tuning performance • Supercomputer platforms compound the complexity — unique hardware — unique microkernel-based operating systems — multifaceted performance concerns – computation – data movement – communication – I/O 3
What Users Want • Multi-platform, programming model independent tools • Accurate measurement of complex parallel codes — large, multi-lingual programs — fully optimized code: loop optimization, templates, inlining — binary-only libraries, sometimes partially stripped — complex execution environments – dynamic loading, static linking – SPMD parallel codes with threaded node programs – batch jobs • Effective performance analysis — insightful analysis that pinpoints and explains problems – correlate measurements with code for actionable results – support analysis at the desired level intuitive enough for application scientists and engineers detailed enough for library developers and compiler writers • Scalable to petascale and beyond 4
“We Build It” * • HPCToolkit - 160K lines, 797 files — measurement, data analysis: 110K lines C/C++, scripts; 424 files — hpcviewer, hpctraceviewer GUIs: 54K lines Java; 373 files • HPCToolkit externals - 2.5M lines C/C++, 5782 files — components developed – execution control: libmonitor - 7K lines, 35 files – binary analysis: Open Analysis - 76K lines, 343 files (+ ANL, Colorado) — components extensively modified – binary analysis: GNU binutils - 1.44M total, 1650 files; (448K bfd) — other components – stack unwinding: libunwind – XML: libxml2, xerces – understanding binaries: libelf, libdwarf, symtabAPI * With support from the US government DOE Office of Science: DE-FC02-07ER25800, DE-FC02-06ER25762 LANL: 03891-001-99-4G, 74837-001-03 49, 86192-001-04 49, 12783-001-05 49 5 AFRL: FA8650-09-C-7915
Contributors • Current — staff: Michael Fagan, Mark Krentel, Laksono Adhianto — students: Xu Liu, Milind Chabbi, Karthik Murthy — external: Nathan Tallent (PNNL) • Alumni — students: Gabriel Marin (ORNL), Nathan Froyd (Mozilla) — staff: Rob Fowler (UNC) — interns: Sinchan Banerjee (MIT), Michael Franco (Rice), Reed Landrum (Stanford), Bowden Kelly (Georgia Tech), Philip Taffet (St. John’s High School) 6
HPCToolkit Approach • Employ binary-level measurement and analysis — observe fully optimized, dynamically linked executions — support multi-lingual codes with external binary-only libraries • Use sampling-based measurement (avoid instrumentation) — controllable overhead — minimize systematic error and avoid blind spots — enable data collection for large-scale parallelism • Collect and correlate multiple derived performance metrics — diagnosis typically requires more than one species of metric • Associate metrics with both static and dynamic context — loop nests, procedures, inlined code, calling context • Support top-down performance analysis — natural approach that minimizes burden on developers 7
Outline • Overview of Rice’s HPCToolkit • Pinpointing scalability bottlenecks — scalability bottlenecks on large-scale parallel systems — scaling on multicore processors • Understanding temporal behavior • Assessing process variability • Understanding threading, GPU, and memory hierarchy — blame shifting — attributing memory hierarchy costs to data • Summary and conclusions 8
HPCToolkit Workflow profile call path compile & link execution profile [hpcrun] source optimized code binary binary program analysis structure [hpcstruct] presentation interpret profile database correlate w/ source [hpcviewer/ [hpcprof/hpcprof-mpi] hpctraceviewer] 9
HPCToolkit Workflow profile call path compile & link execution profile [hpcrun] source optimized code binary binary program analysis structure [hpcstruct] • For dynamically-linked executables on stock Linux — compile and link as you usually do • For statically-linked executables (e.g. for Blue Gene, Cray) — add monitoring by using hpclink as prefix to your link line presentation interpret profile database correlate w/ source [hpcviewer/ [hpcprof/hpcprof-mpi] hpctraceviewer] 10
HPCToolkit Workflow profile call path compile & link execution profile [hpcrun] source optimized code binary binary program analysis structure [hpcstruct] • Measure execution unobtrusively — launch optimized application binaries – dynamically-linked applications: launch with hpcrun e.g., mpirun -np 8192 hpcrun -t -e WALLCLOCK@5000 flash3 ... – statically-linked applications: control with environment variables — collect statistical call path profiles of events of interest presentation interpret profile database correlate w/ source [hpcviewer/ [hpcprof/hpcprof-mpi] hpctraceviewer] 11
Call Path Profiling Measure and attribute costs in context sample timer or hardware counter overflows gather calling context using stack unwinding Call path sample Calling context tree return address return address return address instruction pointer Overhead proportional to sampling frequency... ...not call frequency 12
HPCToolkit Workflow profile call path compile & link execution profile [hpcrun] source optimized code binary binary program analysis structure [hpcstruct] • Analyze binary with hpcstruct : recover program structure — analyze machine code, line map, debugging information — extract loop nesting & identify inlined procedures — map transformed loops and procedures to source presentation interpret profile database correlate w/ source [hpcviewer/ [hpcprof/hpcprof-mpi] hpctraceviewer] 13
HPCToolkit Workflow profile call path compile & link execution profile [hpcrun] source optimized code binary binary program analysis structure [hpcstruct] • Combine multiple profiles — multiple threads; multiple processes; multiple executions • Correlate metrics to static & dynamic program structure presentation interpret profile database correlate w/ source [hpcviewer/ [hpcprof/hpcprof-mpi] hpctraceviewer] 14
HPCToolkit Workflow profile call path compile & link execution profile [hpcrun] source optimized code binary binary program analysis structure [hpcstruct] • Presentation — explore performance data from multiple perspectives – rank order by metrics to focus on what’s important – compute derived metrics to help gain insight e.g. scalability losses, waste, CPI, bandwidth — graph thread-level metrics for contexts — explore evolution of behavior over time presentation interpret profile database correlate w/ source [hpcviewer/ [hpcprof/hpcprof-mpi] hpctraceviewer] 15
Analyzing Chombo@1024PE with hpcviewer costs for • inlined procedures source pane • loops • function calls in full context view control metric display navigation pane metric pane 16
Outline • Overview of Rice’s HPCToolkit • Pinpointing scalability bottlenecks — scalability bottlenecks on large-scale parallel systems — scaling on multicore processors • Understanding temporal behavior • Assessing process variability • Understanding threading, GPU, and memory hierarchy — blame shifting — attributing memory hierarchy costs to data • Summary and conclusions 17
The Problem of Scaling 1.000 ? 0.875 Efficiency 0.750 Ideal efficiency Actual efficiency 0.625 0.500 1 4 6 4 6 4 6 4 6 1 6 5 2 9 8 3 2 0 0 3 5 1 4 6 5 1 6 CPUs Note: higher is better 18
Wanted: Scalability Analysis • Isolate scalability bottlenecks • Guide user to problems • Quantify the magnitude of each problem 19
Challenges for Pinpointing Scalability Bottlenecks • Parallel applications — modern software uses layers of libraries — performance is often context dependent Example climate code skeleton main land sea ice ocean atmosphere wait wait wait wait • Monitoring — bottleneck nature: computation, data movement, synchronization? — 2 pragmatic constraints – acceptable data volume – low perturbation for use in production runs 20
Recommend
More recommend
Explore More Topics
Stay informed with curated content and fresh updates.
