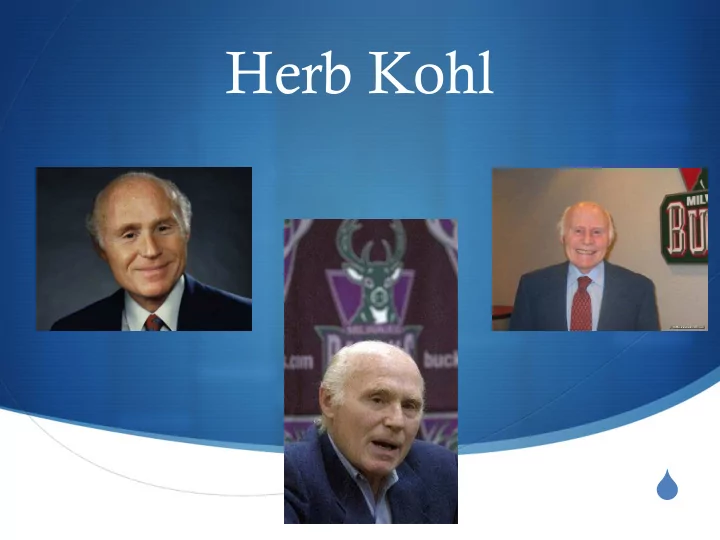

Herb Kohl
Year Revenue NBA Milwaukee Bucks Rank (of 30) Revenue 2009 $94 30 th million The Milwaukee Bucks continuously fall in last place 2010 $91 30 th in the NBA in terms of team million revenue (as estimated by 2011 $92 30 th Forbes magazine). million 2012 $92 30 th million 2013 $87 30 th million
Milwaukee Bucks Year Amount NBA Rank Payroll (of 30) 2009-10 $67.1 15 th million The Milwaukee Bucks 2010-11 $67.7 12 th continuously fall near the million middle or within the top two- 2011-12 $60.1 20 th thirds of the NBA in total million team salary. 2012-13 $61.6 23 rd million
Attendance and Performance Figures Attendance Performance Year Total Average % Rank Wins Losses % Post-Season 2007-08 639,629 15,595 83 26 56 .317 2008-09 630,976 15,389 82 34 48 .415 2009-10 619,453 15,108 81 46 36 .561 Lost First 24th Round (Atlanta) 4-3 2010-11 631,910 15,412 82 23rd 35 47 .427 2011-12 485,717 14,718 79 26th 31 31 .469
Herb Kohl’s Statements “The time is now to plan or find a new way to finance or build a 1. new arena to replace the Bradley Center. It’s not something we talk about any more, it has to be more than talk.” “I will make a personal financial commit toward a new arena, 2. which would not be insignificant, but it ultimately will take a public-private combination to build it.” “Milwaukee’s chances for remaining a part of the NBA are not 3. robust without a new facility.”
Public Funding of Arenas – 2000 Forward Team Arena Name Publicly Financed Charlotte Bobcats (2005) Time Warner Cable Arena 100% Dallas Mavericks (2001) American Airlines Arena 30% Houston Rockets (2003) Toyota Center 100% Memphis Grizzlies (2004) FedEx Forum 83% Brooklyn Nets Barclays Center 40% Oklahoma City Thunder (2002) Chesapeake Energy Arena 100% Orlando Magic (2010) Amway Center 87.5% San Antonio Spurs (2002) AT&T Center 84% Source: Marquette University NSLI Sports Facility Reports
New Seattle Arena
New San Francisco Arena
New Sacramento Arena
Sale of NBA Teams Date Amount (Millions) March 2010 Michael Jordan, already a minority owner, buys a large portion of the Charlotte Bobcats for $275 million and assumed $150 million in debt from former owner Bob Johnson, who himself paid $300 million for the franchise. May 2010 Mikhail Prokhorov purchased 80% of the then-New Jersey Nets for $200 million, all while assuming $180 million in debt. June 2010 Ted Leonsis bought the Washington Wizards from the late Abe Pollin’s family to meet an estimated value of $550 million. July 2010 Joe Lacob and Peter Guber won the bid to buy the Golden State Warriors for a then-NBA-record $450 million. June 2011 The Detroit Pistons were bought by Tom Gores for a reported $325 million. October 2011 A group led by Joshua Harris bought the Philadelphia 76ers for $280 million. June 2012 Tom Benson’s ownership group purchased the New Orleans Hornets from the NBA for $338 million. October 2012 Robert Pera officially bought the Memphis Grizzlies for $337 million. Source: www.sbnation.com/nba
The Business Journal Poll (2012-13) Do you support a regional tax to fund a Do you support a dedicated sales tax to new basketball arena? support Milwaukee area arts and cultural institutions? Yes: 40% Yes: 32% No: 58% No: 64% Undecided: 2% Undecided: 4% Votes cast: 801 Votes Cast: 866 Should Milwaukee enact a sales tax to help fund a new basketball arena? Should the Miller Park sales tax be extended to help pay for a new basketball Yes: 41% arena? No: 56% Yes: 40% Undecided: 3% No: 57% Votes Cast: 809 Undecided: 3% Votes Cast: 797
Private Side Contributions Owner or team’s contribution Loans Pledges or monetization of contractually obligated income, including naming rights, sponsorships, and enhanced seating Equity contributions from concessionaires, management companies, service or rights providers Charitable contributions Personal Seat Licenses or other creative seat revenue generators Grants
Recommend
More recommend