Haircuts and Repo Rates: Evidence from Money Market Mutual Fund - PDF document
Aggregate Patterns of Repo Funding Theory Empirical Results Haircuts and Repo Rates: Evidence from Money Market Mutual Fund Filings Arvind Krishnamurthy 1 Stefan Nagel 2 Dmitry Orlov 2 1 Northwestern University 2 Stanford University November
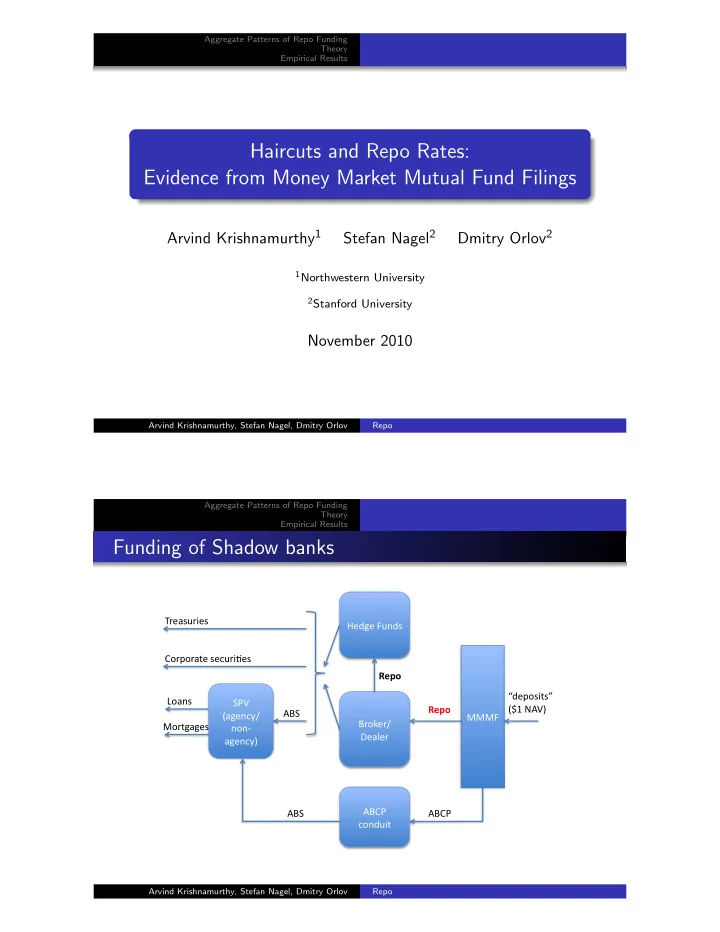
Aggregate Patterns of Repo Funding Theory Empirical Results Haircuts and Repo Rates: Evidence from Money Market Mutual Fund Filings Arvind Krishnamurthy 1 Stefan Nagel 2 Dmitry Orlov 2 1 Northwestern University 2 Stanford University November 2010 Arvind Krishnamurthy, Stefan Nagel, Dmitry Orlov Repo Aggregate Patterns of Repo Funding Theory Empirical Results Funding of Shadow banks Treasuries Hedge Funds Corporate securiAes Repo “deposits” Loans SPV Repo ($1 NAV) ABS (agency/ MMMF Broker/ Mortgages non‐ Dealer agency) ABCP ABS ABCP conduit Arvind Krishnamurthy, Stefan Nagel, Dmitry Orlov Repo
Aggregate Patterns of Repo Funding Theory Empirical Results Tri-Party Repurchase Agreements $95m $95m Tri‐party Broker/ Clearing MMMF Dealer Agent Collateral Collateral worth worth $100m $100m Haircut: 5% in this example Repo rate: Interest paid by borrower on loan amount ($95m) Daily unwind: Irrespective of repo term, each morning cash returned to lender and security to borrower. Thus, intra-day counterparty risk shifted to tri-party agent. Arvind Krishnamurthy, Stefan Nagel, Dmitry Orlov Repo Aggregate Patterns of Repo Funding Theory Empirical Results Objectives Which role did repo market play in financial crisis? How big is repo funding? Often used federal Reserve data on primary dealer repos includes inter-dealer repos (double-counting issue) “Run on repo” an in important part of the breakdown of “securitized banking” (Gorton and Metrick 2009)? Evaluate size of repo funding with private-label ABS/MBS as collateral How are repos structured and risks priced? Participation constraints, haircuts, repo rates Evaluate role of counterparty risk, collateral risk, ... View through lens of theories of collateralized lending and security design We obtain data on repo agreements of MMF from quarterly SEC filings (N-CSR, N-CSRS, N-Q) 2006Q4-2010Q2 Arvind Krishnamurthy, Stefan Nagel, Dmitry Orlov Repo
Aggregate Patterns of Repo Funding Theory Empirical Results Example: Reserve Fund – Primary Fund February 29, 2008 Repurchase Agreements Notional Counterparty Rate Init. Rep. Collateral Coll. mkt.val. 1,000,000,000 Bear Stearns 3.28%, 2/29/08, 3/3/08 ABS, CMO, TRR, TR3 1,048,922,871 450,000,000 Bear Stearns 3.33% 2/29/08 3/3/08 ABS, CMO 472,500,201 500,000,000 Citigroup 3.23% 2/29/08 3/3/08 MNI, TRR 556,131,379 140,000,000 Merrill Lynch 3.43% 2/29/08 3/3/08 WLR 146,599,193 1,000,000,000 Morgan Stanley 3.29% 2/29/08 3/3/08 WLR 1,020,794,540 ... Arvind Krishnamurthy, Stefan Nagel, Dmitry Orlov Repo Aggregate Patterns of Repo Funding Theory Empirical Results Data collection Concentrated market: Biggest 10 MMF families control about 60% of MMF assets under management Aim: Collect data for 20 biggest MMF families Completed so far: Blackrock Fidelity JPMorgan Reserve Funds Morgan Stanley Vanguard Dreyfus Goldman Sachs Federated Funds Arvind Krishnamurthy, Stefan Nagel, Dmitry Orlov Repo
Aggregate Patterns of Repo Funding Theory Empirical Results Outline 1 Aggregate Patterns in Repo Funding “Run on Repo” quantitatively important? 2 Theory: repo market participation, collateral choice, maturity, haircuts, repo rates 3 Empirical results Arvind Krishnamurthy, Stefan Nagel, Dmitry Orlov Repo Aggregate Patterns of Repo Funding Theory Empirical Results Coverage of MMF Filings Sample Quarter MMF Repo MMF Repo MMF Primary collected Total Assets Dealer Repo ($bn.) (FoF, $bn.) (FoF, $bn.) (NY Fed, $bn.) (133) 1 2006Q4 395 2312 3442 2007Q1 202 387 2372 3619 2007Q2 205 426 2466 3889 2007Q3 258 528 2780 3886 2007Q4 283 606 3033 4106 2008Q1 307 592 3383 4278 2008Q2 273 518 3318 4222 2008Q3 261 592 3355 3989 2008Q4 276 542 3757 3208 2009Q1 367 562 3739 2743 2009Q2 339 488 3585 2582 2009Q3 325 495 3363 2499 2009Q4 338 480 3259 2469 2010Q1 296 440 2931 2477 (66) 1 2010Q2 1 Incomplete coverage in 2006Q4 and 2010Q2 Arvind Krishnamurthy, Stefan Nagel, Dmitry Orlov Repo
Aggregate Patterns of Repo Funding Theory Empirical Results Share of Collateral by Type (by value) 1 .8 .6 Share .4 2007q1 2008q1 2009q1 2010q1 Quarter U.S. Treasury Agency Priv. ABS Corporate Other Arvind Krishnamurthy, Stefan Nagel, Dmitry Orlov Repo Aggregate Patterns of Repo Funding Theory Empirical Results Comparison with ABCP Issuance .15 250 200 .1 Priv. ABS Share Issuance () 150 .05 100 50 0 2007q1 2008q1 2009q1 2010q1 Quarter ABCP Issuance Priv. ABS Share Issuance of 80day+ ABCP net of amount funded through Fed CPFF program Total contraction of ABCP outstanding ≈ $700bn. compared with pre-crisis repo with priv. ABS/MBS collateral ≈ $60bn. Arvind Krishnamurthy, Stefan Nagel, Dmitry Orlov Repo
Aggregate Patterns of Repo Funding Theory Empirical Results Maturity percentiles (vw.) 250 200 Maturity (business days) 150 100 50 0 2006q3 2007q3 2008q3 2009q3 2010q3 Quarter 99th 98th 95th 90th Arvind Krishnamurthy, Stefan Nagel, Dmitry Orlov Repo Aggregate Patterns of Repo Funding Theory Empirical Results Maturity percentiles (ew.) 250 200 Maturity (business days) 150 100 50 0 2006q3 2007q3 2008q3 2009q3 2010q3 Quarter 90th 80th 70th 60th Arvind Krishnamurthy, Stefan Nagel, Dmitry Orlov Repo
Aggregate Patterns of Repo Funding Theory Empirical Results Haircuts by Collateral Type (vw.) 8 6 Percent 4 2 2007q1 2008q1 2009q1 2010q1 Quarter U.S. Treasury Agency Priv. ABS Corporate Other Arvind Krishnamurthy, Stefan Nagel, Dmitry Orlov Repo Aggregate Patterns of Repo Funding Theory Empirical Results Average Repo Rate (vw.) and Fed Funds Rate/OIS 6 4 Percent 2 0 2006q3 2007q3 2008q3 2009q3 2010q3 Quarter Fed Funds Rate/OIS Average Repo Rate (vw.) Arvind Krishnamurthy, Stefan Nagel, Dmitry Orlov Repo
Aggregate Patterns of Repo Funding Theory Empirical Results Excess Repo Rate by Collateral Type (vw.) 1 .5 Percent 0 −.5 −1 2007q1 2008q1 2009q1 2010q1 Quarter U.S. Treasury Agency Priv. ABS Corporate Other Arvind Krishnamurthy, Stefan Nagel, Dmitry Orlov Repo Aggregate Patterns of Repo Funding Literature Theory Model Empirical Results Results Haircuts and Repo Rates: Theory Modigliani-Miller: Haircut and repo rate indeterminate Haircut = leverage Repo rate = cost of debt Theories of equilibrium haircuts with frictions Geanakoplos (2009): Differences in beliefs between borrower and lender about payoffs from collateral. Equilibrium haircut creates default-free debt Duffie and DeMarzo (1999); Dang, Gorton, Holmstrom (2010): Asymmetric information about collateral payoffs between borrower and lender. Equilibrium haircut creates information-insensitive security (if sufficient concern about adverse selection). Arvind Krishnamurthy, Stefan Nagel, Dmitry Orlov Repo
Aggregate Patterns of Repo Funding Literature Theory Model Empirical Results Results Theory of Haircuts and Repo Rates Common predictions of belief divergence and asy. information stories Haircuts should vary with risk of collateral, but repo rates should (mostly) not Counterparty risk should have little effect on haircuts and repo rates Theories miss some aspects that seem important in practice Repo is not no-recourse: Repo lenders have recourse to borrowers balance sheet in event of default Differences in beliefs and asy. information can not explain exclusion of high-risk counterparties and low-quality collateral from repo market Arvind Krishnamurthy, Stefan Nagel, Dmitry Orlov Repo Aggregate Patterns of Repo Funding Literature Theory Model Empirical Results Results Model Two dates, t 0 and t 1 . Single risky asset with t 0 price P 0 = 1 (partial equilibrium) Borrower (trading desk in a bank) considers purchase of one unit of risky asset with funding 1 − h from repo lender (MMF), collateralized by risky asset, i.e., with haircut h h from bank (“equity”) Four states of nature: At time t − 1 just before date t 1 , the bank defaults with probability π d . Then, at t 1 , independent of whether the bank defaulted or not, the risky asset can be traded at price of R > 1 in the good state and L < 1 in the bad state. Lenders are competitive. Lender, bank, and borrower are risk-neutral. Arvind Krishnamurthy, Stefan Nagel, Dmitry Orlov Repo
Recommend


More recommend
Explore More Topics
Stay informed with curated content and fresh updates.