Growth of microorganisms in culture: example of the phytoplancton - - PowerPoint PPT Presentation

growth of microorganisms in culture example of the
SMART_READER_LITE
LIVE PREVIEW

Growth of microorganisms in culture: example of the phytoplancton - - PowerPoint PPT Presentation

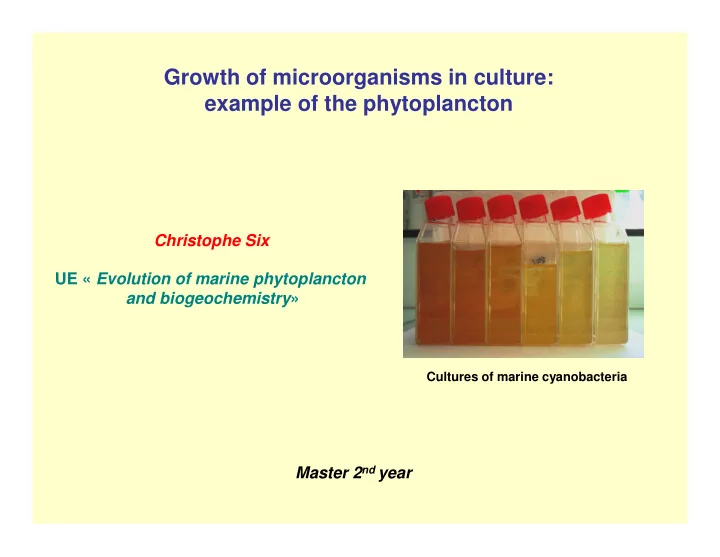
Growth of microorganisms in culture: example of the phytoplancton Christophe Six UE Evolution of marine phytoplancton UE Evolution of marine phytoplancton and biogeochemistry Cultures of marine cyanobacteria Master 2 nd year What is


slide-1
SLIDE 1

Growth of microorganisms in culture: example of the phytoplancton

UE « Evolution of marine phytoplancton Christophe Six

Cultures of marine cyanobacteria

UE « Evolution of marine phytoplancton and biogeochemistry» Master 2nd year

slide-2
SLIDE 2

What is growth?

Higher organisms

Any increase of the biomass of an organism

Microorganisms

Why should we measure growth?

. Ecology: Prey/predator, adaptation… . Evolution: The key of the Natural Selection of Species . Physiology: Integration of the efficiency of all cell processes Can also be the increase of the size of the population of an organism

slide-3
SLIDE 3

How to measure the growth of a phytoplankton culture ?

Monitor the number of cells in the culture function of time

  • Counting slides (Malassez, Thoma, etc…)

250 µm 250 µm 50 µm 200 µm

= 0,01 mm3 = 0,01 µL = 10-5 mL

200 µm

slide-4
SLIDE 4
  • Cell counter (type Wallace H. Coulter)

Detection of conductance

  • f the electrolyte
slide-5
SLIDE 5
  • Flow cytometry
slide-6
SLIDE 6

Monitoring a parameter that varies proportionally to the cell density

  • Photosynthetic pigments
  • Concentration of elements (C, N)
  • Absorption of non-pigmented material (OD 750 nm)

But be careful to acclimation !

How to measure the growth of a phytoplankton culture ?

0,1 0,2 0,3 0,4 0,5 0,6 0,7 0,8 0,9 1 400 450 500 550 600 650 700 750 800 Longueur d'onde (nm) Absorbance (UA)

Non pigmented material Chl a

slide-7
SLIDE 7

Growth in continuous culture: Turbidostat

Sampling

Culture medium

Peristaltic pump

The culture is constantly diluted Culture Trash

  • Constant volume of culture
  • Constant cell density
  • Constant growth rate
  • No limitation
slide-8
SLIDE 8

Growth in closed medium ‘batch cultures)

Cell density

Growth is limited by the capacities of the culture medium

Time

Latence phase Exponentielle phase Transition phase Stationnary phase Decreasing phase

slide-9
SLIDE 9

Latence phase

  • Abrupt medium change = stress
  • ajustment of the physiology to the new medium
  • All transferred cells are not viables
  • The duration and dynamics of the latence phase is often dependent on the mother culture

Temps Cellules

Culture mère Cultures filles

Temps Cellules

slide-10
SLIDE 10

The exponential phase of growth 2 1 4

t 1 t 2 t 3 Binary division

Temps Cellules

8

Cells Time t 4

Time

1 2 4 8

cells

1 2 3 4

slide-11
SLIDE 11

N = N0 . ekT

N0 K : growth constant (= growth rate µ

µ µ µ)

Time Cell density

The exponential phase of growth

ln(N2) – ln (N1) K = t2 – t1 N1 N2 t2 t1

Time Cell density

slide-12
SLIDE 12

. Generation / doubling time tg or td : The time necessary for a cell to divide tg = ln(2) / k

Generation 0 1 2 3

The exponential phase of growth

. Number of divisions per day n :

Generation time tg = 1 day n = 1 division per day Growth rate K = 0,69 jour-1

!

n = 1/ tg => n = k / ln(2)

slide-13
SLIDE 13

The stationnary and decreasing phases

  • Change of the physiology of the cells in response to the limitation

Resistance

Time Cells

  • Dynamics of these phases mal connue

Time Cells Time Cells

k

k

slide-14
SLIDE 14

Measuring a growth rate experimentally

. Estimation from two time points ln(N2) – ln (N1) K =

30 000 000 35 000 000

ion

Time (day) 1 2 3 4 5 6 7 8 9 10 11 12 cell/mL 1 849 596 960 232 1 235 454 2 001 565 2 945 654 5 621 245 10 236 458 20 804 561 26126876 29463189 30109473 30533249 28112286

K = t2 – t1 ln(26126876) – ln (5621245) K = 8 – 5

5 000 000 10 000 000 15 000 000 20 000 000 25 000 000

5 10 15

Time

Cell concentratio N2 N1 t1 t2

K = 0.5121

slide-15
SLIDE 15

Time (day) 1 2 3 4 5 6 7 8 9 10 11 12 cell/mL 1 849 596 960 232 1 235 454 2 001 565 2 945 654 5 621 245 10 236 458 20 804 561 26126876 29463189 30109473 30533249 28112286 Ln (Cell/mL) 14,4305 13,7749 14,02695 14,50944 14,89584 15,54206 16,14147 16,85068 17,07848 17,19865 17,22035 17,23433 17,151717

. Estimation from a natural logarithm regression ln(N) – ln (N0) K = t ln(N) = kt + lnN0

=>

Slope of the regression

Measuring a growth rate experimentally

Ln (Cell/mL) 14,4305 13,7749 14,02695 14,50944 14,89584 15,54206 16,14147 16,85068 17,07848 17,19865 17,22035 17,23433 17,151717

5 000 000 10 000 000 15 000 000 20 000 000 25 000 000 30 000 000 35 000 000

5 10 15

Time

Cell concentration 10 12 14 16 18 20 5 10 15 Ln (Cell concentration)

y = 0,5617x + 12,8 R

2 = 0,9904

10 12 14 16 18 20 2 4 6 8 Ln (Cell concentration)

Time (day)

slide-16
SLIDE 16

Exercise: The influence of light on the growth of a cyanobacterium

Synechococcus sp. WH8102 15 25 50 85 200 700

µmol photons . m-2 . s-1

Strain isolated from oligotrophic waters

slide-17
SLIDE 17

What is the impact of light irradiance on the growth of Synechococcus sp. WH8102 ? Experimental protocole :

  • The cultures were transferred at low cell density
  • The number of cells was determined by flowr cytometry for several days

Exercise: The influence of light on the growth of a cyanobacterium

. Plot the growth curves . Calculate the growth rates (µ = k), nber of divisions/day (n), Doubling time (tg) . Plot the curve showing the evolution of the 3 parameters in function of light irradiance