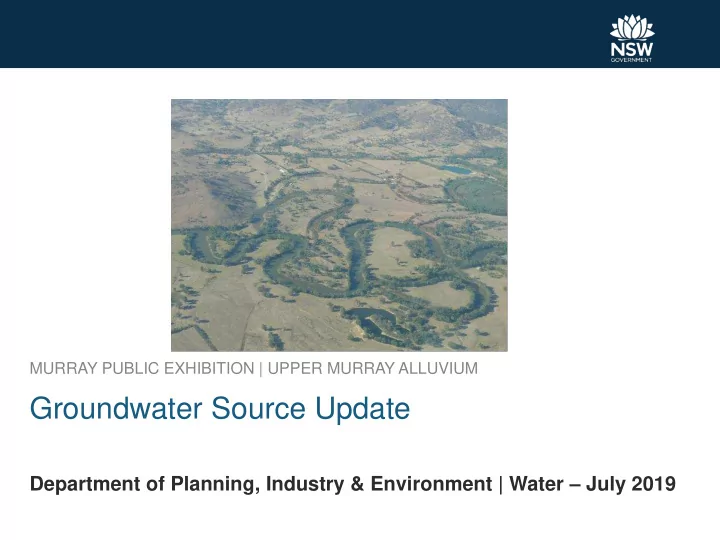

MURRAY PUBLIC EXHIBITION | UPPER MURRAY ALLUVIUM Groundwater Source Update Department of Planning, Industry & Environment | Water – July 2019
Water Source Overview Page 2
Upper Murray Cross Section Map Page 3
Cross Sections Page 4
Cross Sections Page 5
Existing Access Licenses & Extraction Limit – Upper Murray Alluvium Access License Number of Licenses Share Component Category Aquifer 90 41,066 Local Water Utility/Town Water 151 4 Supply Existing extraction limit including BLR : 14,109 ML/year (BLR provision 402 ML) Page 6
Groundwater Trading – Upper Murray Share Component assignment dealings Allocation assignment dealings (71T) (71Q) Year number volume (ML) number volume (ML) 2015-16 2 1,100 0 0 2016-17 2 360 2 45 2017-18 4 1,989 0 0 Page 7
Extraction and Long Term Average Annual Extraction Limit (LTAAEL) – Upper Murray Page 8
Water Source Overview (Upper Murray Usage) Page 9
Monitoring Bore Locations GW036376 Page 10
Hydrograph – GW036306 (Hopefield) Page 11
Hydrograph – GW036281 (Howlong) Page 12
Hydrograph – GW036376 (Howlong - Bungowannah) Page 13
Conclusions • Water levels are generally steady. Limited response to rainfall in the 2010/11 wet year. • The drawdowns in monitoring bores are indicative of areas of groundwater extractions and drawdown spread is limited to local areas of groundwater extractions. • Groundwater extractions have not exceeded the Long Term Average Annual Extraction Limit (LTAAEL) except for 2018/19. • Temporary (71T) and permanent trading (71Q) remain limited. Page 14
Recommend
More recommend