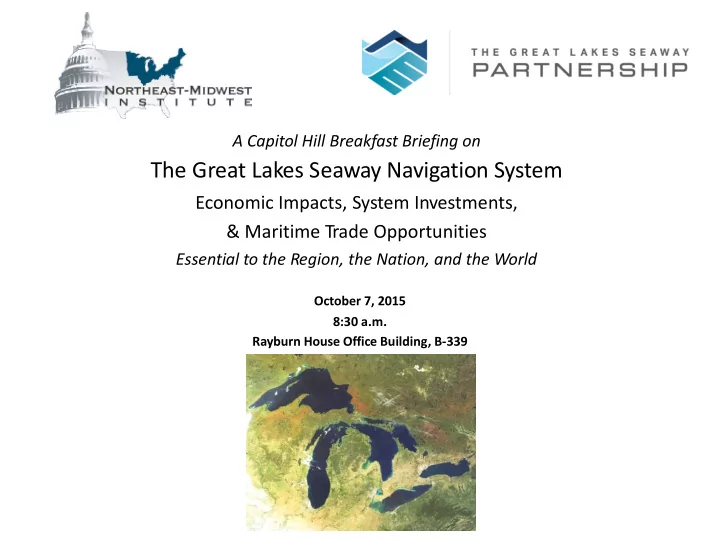

A Capitol Hill Breakfast Briefing on The Great Lakes Seaway Navigation System Economic Impacts, System Investments, & Maritime Trade Opportunities Essential to the Region, the Nation, and the World October 7, 2015 8:30 a.m. Rayburn House Office Building, B-339
GREAT LAKES/ST. LAWRENCE SEAWAY TRANSPORTATION SYSTEM, OPPORTUNITIES AND CHALLENGES Prepared by: Martin Associates www.martinassoc.net 941 Wheatland Ave., Suite 203 October 7, 2015 Lancaster, PA 17603
The GL/SLS System 160 Million Tons Annually 100 Ports 8 States 2 Provinces U.S. Flag Fleet Canadian Flag Fleet International Cargo 2
The GL/SLS Is a Key Economic Catalyst to the U.S. and Canadian Economies • 92,923 direct jobs 226,833 jobs generated • 66,005 induced jobs by marine cargo activity • 67,905 indirect jobs $33.6 billion of direct • Direct revenue from supply of services to cargo and vessels business revenue • $4.4 billion direct wages and salaries -- $47,000 average $14.1 billion total salary for direct employees personal income and local • $6.9 billion re-spending/local consumption consumption • $2.9 billion indirect income $4.5 billion of federal, • $1.5 billion of state/provincial and local tax revenue state/provincial and local • $3.0 billion of federal tax revenue taxes 3
Distribution of Direct Jobs by Country Job Impacts by Country 100,000 90,000 80,000 70,000 60,000 50,000 40,000 30,000 20,000 10,000 0 Direct Induced Indirect Canada U.S. 4
Total Jobs by State and Province 35,013 Jobs 63,542 Jobs 6,271 Jobs 1,967 Jobs 8,777 Jobs 26,819 Jobs 854 Jobs 28,081 48,332 Jobs Jobs 7,177 Jobs 5
Direct, Induced and Indirect Jobs Created by U.S. and Canadian Flag Lakers 107,612 101,568 Jobs Jobs 6
Nearly 500,000 Additional Jobs with Users Are Related to the Cargo Activity on the GL/SLS 477,593 jobs related to • 393,262 related jobs in the U.S. • 84,331 related jobs in Canada the marine cargo activity $115.5 billion of • $83.9 billion related revenue in the U.S. • $31.6 billion related revenue in Canada related business revenue $22.7 billion related • $18.2 billion related wages and salaries personal income and local • $4.5 billion re-spending/local consumption consumption $7.0 billion of related • $5.1 billion of related taxes in the U.S. federal, state/provincial • $1.9 billion of related taxes in Canada and local taxes 7
Since 2009, $6.9 Billion of Public and Private Sector Investment on the GL/SLS Billions of 2013 $ $1.2 $4.0 $1.7 Vessel Ports & Terminals Waterway Infrastructure 8
Investment on the GL/SLS is Driven by Private Sector Investment Billions of 2013 $ $2.3 $4.6 Private Sector Ports and Terminals 9
Opportunities Focus on near port/on-port industrial development: - Bulk and aggregates - Steel manufacturing/assembly - Leverage industrial development to maximize use of ports - Higher value commodities Development of clean energy port complex: - Wind energy: - In-land project development - Off-shore production - Manufacturing and educational/research complex - LNG bunkering: - Compliance with ECA - Bio fuels – wood chips 10
Marcellus and Utica Shale Deposits Present Significant Opportunities 11
Energy Market Provide vessel transit for LNG and NGL to serve East Coast as well as export Provide fuel for local markets: - Trucking - Vessel - Utilities Supply oil fields: - Fracking Sand - Equipment 12
Develop Liner Service Development of liner services: - Cleveland aggressively pursued development of liner service - Identification of local markets now using coastal ports: - Containers - RoRo, Project Cargo - Break Bulk - Minimize port calls on GL/SLS to maintain schedule integrity 13
Polar Routing of Energy Projects?? 14
Opportunities Enhance federal opportunities to expand regional trade and economic development - Maximize U.S. Seaway Corporation (SLSDC) authorities to include bonds, loans and other federal assistance - Ensure future national maritime and transportation policies, regulations, and laws incorporate Great Lakes Seaway System maritime commerce options for resiliency 15
Challenges Growth in vessel size Limited shipping season Maintenance dredging issues: - Lack of maintaining St. Marys River at authorized depth costs U.S. Flag maritime industry nearly $20 million/year Ice breaking issues: - 2015 season ice impacts - Loss of 3.2 million tons from January through April 2015 (US Flag) - Nearly 2,000 jobs impacted - $355.6 million of revenue lost 16
Challenges Limited volume for multiple liner services Tolls Insurance Transload of grain into containers Decline in coal use in utilities: - Substitute fuels - LNG - Wind energy Enforcement of ECA’s: - Low sulphur fuel requirements - Scrubbers - LNG propulsion 17
THANK YOU! 18
A Capitol Hill Breakfast Briefing on The Great Lakes Seaway Navigation System Economic Impacts, System Investments, & Maritime Trade Opportunities Essential to the Region, the Nation, and the World October 7, 2015 8:30 a.m. Rayburn House Office Building, B-339
Recommend
More recommend