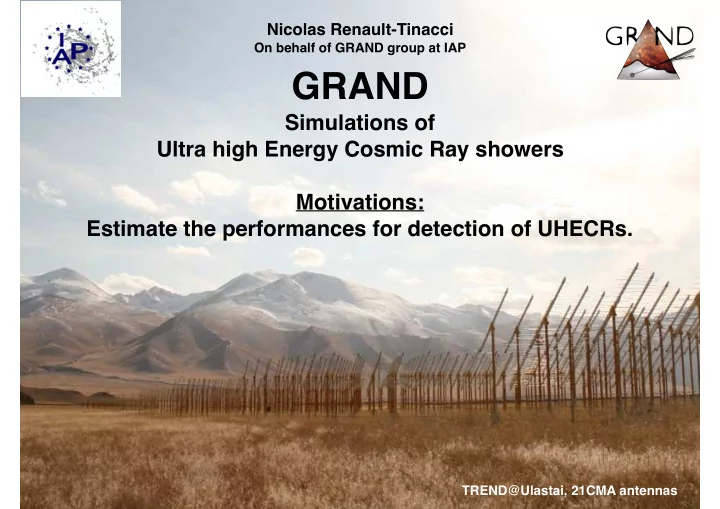

Nicolas Renault-Tinacci On behalf of GRAND group at IAP GRAND Simulations of Ultra high Energy Cosmic Ray showers Motivations: Estimate the performances for detection of UHECRs. TREND@Ulastai, 21CMA antennas
How did we proceed ? Simulations performed with ZHAireS Array : _ Flat array 17x18 lines • 120 combinations of (E, ϕ , θ ): _ 1km-step ⇒ 306 km 2 _ E in [10 17.5 - 10 19.5 ] eV with ~ GRANDproto300 1/2-decade step (5 values) _ Array altitude = 1500 m _ ϕ in [0, 180[ deg with 45deg _ At Ulastai location step (4 values, the 4 others obtained by symmetry) Antenna trigger condition: _ θ in [95-120] deg (larger than in prelim _ conservative study) in GRAND convention ( ⬄ ✴ V pp >150µV (10 σ noise ) [60-85] deg in CR convention) with 5deg _ aggressive step (6 values) ✴ V pp >50µV (3 σ noise ) _ for each set 10 random core positions. Shower detection condition: _ 5+ triggered antennas
Core position random drawing Random uniform draw of (x,y) in a [-50km, +50km] box • Computation of the number of antennas within the footprint • _ If N antennas ≥ 5 ⇒ shower selected, otherwise new draw. ✴ Minimum number of antennas quite agressive (8 should be considered instead) _ N tries is stored for each set and each core position selected. selected shower core Easting [m] Easting [m] footprint array Tried shower core Northing [m] Northing [m]
Performance calculations Number of detected showers for a ( θ , E) combination draw area = 10000 km 2 number of tries to obtain a core position with 5 antennas in the footprint • A eff ( θ , E) = A draw cos( θ ) N trig ( θ , E) / N tries ( θ , E) with N xx = ∑ ϕ N xx ( θ , E, ϕ ) for xx = trig or tries Summed of all the ϕ values • Aperture(E) = ∫∫ A eff ( θ , E) sin( θ ) d θ d ϕ • Exposure(E) = Aperture(E) Ỏ t • dN/dE/dt(E) = Exposure(E) Flux(E) • Event rate(E) = ∫ dN/dE/dt(E) dE
Effective area The differences between scenarios are more important at low θ i.e. • where the footprints are smaller. At high θ , a factor 2 or 3 max is lost from aggressive to conservative. • Not many differences in terms of loss between high and low energies •
Aperture and Exposure • Above 10 19 eV, the aperture is ~470 000 km 2 .sr compared to 107 000 km 2 .sr obtained in the preliminary study. • It corresponds to an exposure after 5 years of live time of 2.4e6 km 2 .sr.yr (~8e13 km 2 .sr.s) compared to 535 000 km 2 .sr.yr in the preliminary study Bias warning! Results are a factor 4/5 above those of the preliminary study • when rescaling from 306 km 2 to GRAND200k. Only showers with core within array should be accounted for (edge effect). 1 year livetime Preliminary study =10.4
Event rates for agressive (resp. conservative) case 17.5 -10 19.5 ] eV for GRANDproto300 • 348 (resp. 229) events expected daily for E in [10 Bias warning! 5 (resp. 1.5x10 5 ) day -1 for E in [10 17.5 -10 19.5 ] eV for GRAND200k compared • 2.3x10 6 (resp. 4x10 5 ) day -1 in the preliminary study for [10 17 -10 19 ] eV. when rescaling from to 2x10 306 km within array should be accounted for Only showers with core 2 to GRAND200k. 18 -10 19 ] eV for GRANDproto300 • 11 (resp. 8.5) events expected daily for E in [10 (edge effect). -1 for E>10 19 eV for GRAND200k compared to ~100 day -1 in • 448 (resp. 296) day the preliminary study (4/5 times higher)
Event rates for agressive (resp. conservative) case • 4071 (resp. 3115) events expected in 1 year for E in [10 18 - 10 19 ] eV for GRANDproto300 • 29 061 (resp. 25 286) events expected in 1 year for E>10 19.5 eV for GRAND200k compared to the ~6400 UHECRs Bias warning! predicted in the preliminary study (4/5 times higher) when rescaling from 306 km 2 to GRAND200k. Only showers with core within array should be accounted for (edge effect).
Conclusion, remarks, perspectives • High performances but increased by a factor of 4/5 w.r.t the preliminary study (which was an underestimation of the perfs) • Can be explained by: _ preliminary study perfs underestimated ⇐ only showers with their core within the array which is not the case in the current study. _ GRAND200k perfs overestimated ⇐ showers with core not within the array are accounted for making the extrapolation from GRANDproto300 tricky (edge effect). _ low minimum number of antennas criterion (N minAnt = 5) used to determine a shower as detected. ✴ From a very quick look (only on perfs calculations), with N minAnt = 8, performances are decreased by 10 to 50% depending on energy range. ✴ Re-run simulations with N minAnt = 8 (for core position random drawing) ⇒ ↗ N tries ⇒ ↘︎ performances. • For the WP v2: _ analysis redone with a more conservative minimum number of antenna criterion and 10k instead of 2 300 km _ extrapolate the results from GRANDproto300 to GRAND by considering ONLY events with the core within the array _ compute the number of “fully included in the array” events • Done within the next month or so.
Recommend
More recommend