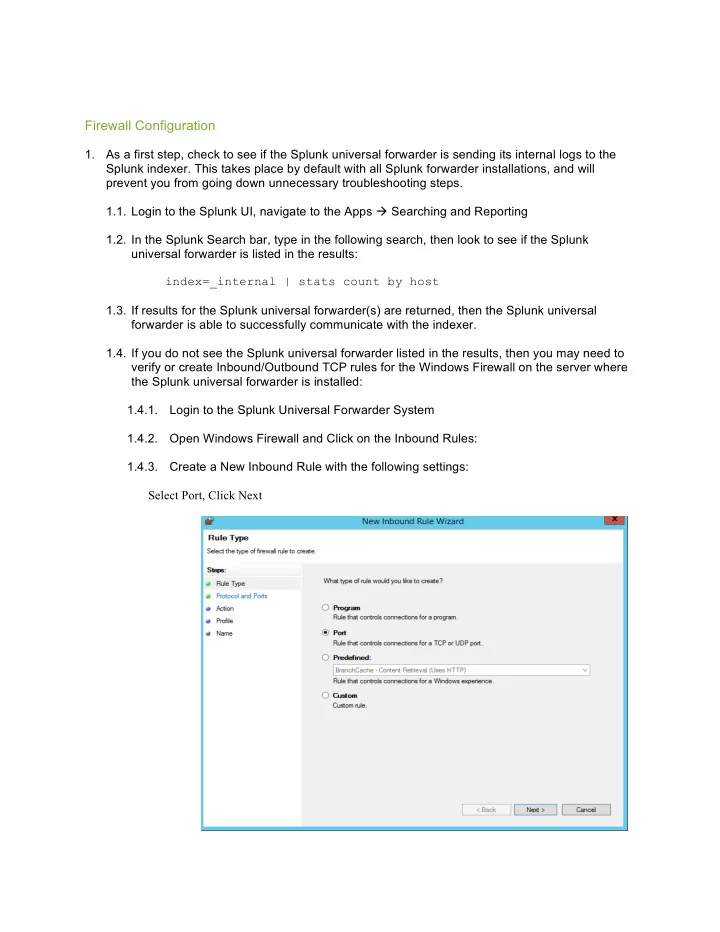

Firewall Configuration 1. As a first step, check to see if the Splunk universal forwarder is sending its internal logs to the Splunk indexer. This takes place by default with all Splunk forwarder installations, and will prevent you from going down unnecessary troubleshooting steps. 1.1. Login to the Splunk UI, navigate to the Apps à Searching and Reporting 1.2. In the Splunk Search bar, type in the following search, then look to see if the Splunk universal forwarder is listed in the results: index=_internal | stats count by host 1.3. If results for the Splunk universal forwarder(s) are returned, then the Splunk universal forwarder is able to successfully communicate with the indexer. 1.4. If you do not see the Splunk universal forwarder listed in the results, then you may need to verify or create Inbound/Outbound TCP rules for the Windows Firewall on the server where the Splunk universal forwarder is installed: 1.4.1. Login to the Splunk Universal Forwarder System 1.4.2. Open Windows Firewall and Click on the Inbound Rules: 1.4.3. Create a New Inbound Rule with the following settings: Select Port, Click Next
Enter in Port Values from below list, Click Next Windows Member Server Ports: 8089 Windows Domain Controller: 8089, 9997, 389, 3268 Click Allow the Connection, then Click Next Select Domain, Private, and Public, then Click Next
Enter the following values and then Click Finish Name: Splunk – Inbound Rule Description: Ports – [Enter the Ports specified previously] 1.4.4. Click on the Outbound Rules link: Create a New Outbound Rule with the following settings: Select Port, then Click Next
Enter in Port values from below list, then Click Next Windows Member Server Ports: 8089, 9997 Windows Domain Controller: 8089, 9997, 389, 3268 Click Allow the Connection, then Click Next
Select Domain, Private, and Public, then Click Next Enter the following values and then Click Finish Name: Splunk – Inbound Rule Description: Ports – [Enter the Ports specified previously]
1.5. Restart Splunk Forwarder Service
2. Next, verify the settings that were provided during the Splunk universal forwarder installation were saved correctly and without errors. 2.1. Login the server where the Splunk universal forwarder is installed 2.2. Open Windows File Explorer and navigate to $SPLUNK_HOME/etc/system/local directory. 2.3. Using Notepad, open the file outputs.conf 2.3.1. If there is no outputs.conf, then you can add the needed settings by using the following Splunk commands in a command line terminal (navigate into the $SPLUNK_HOME/bin directory to execute the command) splunk add forward-server <ip address or hostname>:<port> splunk restart (the ip address or hostname are that of the Splunk indexer, and the default forwarding port is 9997) 2.3.2. Now open the outputs.conf file and verify the ip address or hostname in the are correct for the Splunk server/indexer. 2.4. Using Notepad, open the deploymentclients.conf 2.4.1. If there isn’t a deploymentclients.conf, then you can add the needed settings by using the following Splunk commands in a command line terminal (navigate into the $SPLUNK_HOME/bin directory to execute the command) splunk set deploy-poll <ip address or hostname>:<port> splunk restart (the ip address or hostname are that of the Splunk deployment server, and the default management port is 8089) 2.4.2. Now open the deploymentclients.conf file and verify the ip address or hostname in the are correct for the Splunk Deployment Server system.
Missing data from the Splunk UF inputs This section covers some of the common troubleshooting and resolution steps for when a Splunk universal forwarder has data inputs enabled, but they are not showing up in the Splunk server user interface (i.e. search results). Note that you only do this if you ran the previous search, index=_internal | stats count by host and the target Splunk universal forwarder is able to send/index its internal log data. 1. First, you’ll need to Complete the setup of the Splunk App for Windows Infrastructure by walking through the “Initial Setup Wizard” then Verify and update the Splunk Access Control Settings to add Windows Roles to a Splunk Role you are in. 1.1. In the Splunk UI, navigate to Settings à Access Controls à Roles 1.2. Click on the admin role, or any other role that you want to give access to the Windows data being indexed by Splunk. 1.3. Scroll down to the Inheritance section, and click on the windows-admon and winfra-admin roles to add them to the Selected roles box. 1.4. Click the Save button. 2. If you’re not seeing AD MSAD data, then verify and update PowerShell’s Execution Policy. NOTE: This step is for Active Directory Domain Controllers ONLY. Like most applications that integrate and specifically monitor Active Directory, Splunk leverages PowerShell to collect detailed information from the Active Directory Domain and Domain Controller. In order for the Splunk forwarder to initiate the pre-built PowerShell scripts, the Execution Policy of PowerShell must be at least RemoteSigned. 2.1. Run Powershell console as an Administrator: 2.1.1. Go to Start à Programs à Accessories à PowerShell and right-click then select Run As Administrator. 2.2. Check/Update the current Powershell ExecutionPolicy Setting: 2.2.1. Type get-executionpolicy in the powershell command window. 2.2.2. If it states RemoteSigned, then exit the PowerShell command window by typing exit. 2.2.3. Otherwise type set-executionpolicy RemoteSigned and enter y to accept. 2.3. Then exit the powershell command by typing exit. 3. If you’re not seeing AD admon – Sync (baseline) data 3.1. Run the following search in Splunk search bar
sourcetype=ActiveDirectory admonEventType=Sync 3.2. If you are not seeing results, then perform the following steps on the Splunk universal forwarder on the domain controller: 3.2.1. Login to the DC where the Splunk universal forwarder is installed. 3.2.2. Using Windows File Explorer, navigate to the $SPLUNK_HOME\SplunkUniversalForwarder\var\lib\splunk\persistentstorage\ADMon directory. 3.2.3. Delete the ADMonitoring.ini file. 3.2.4. Restart the SplunkForwarder Service. 3.2.5. Rerun the following search from the Splunk UI to verify admon baseline data is being indexed. sourcetype=ActiveDirectory admonEventType=Sync 3.2.6. If you are now seeing data from verification search, then can complete the AD Objects Splunk Lookup file building steps in the Build AD Lookup Lists – Main view.
Recommend
More recommend