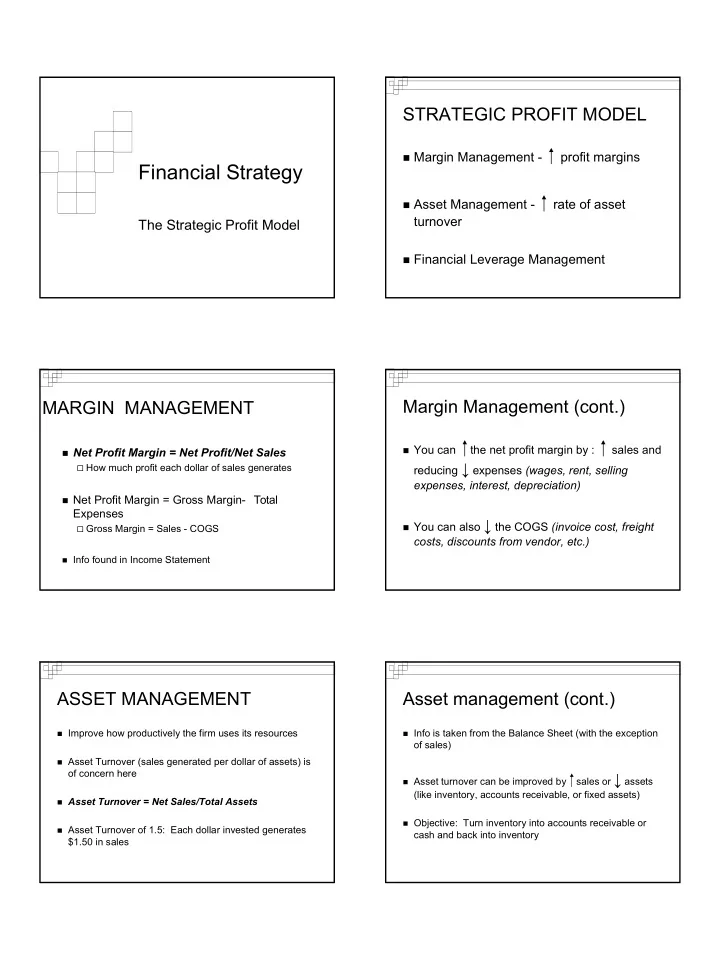

STRATEGIC PROFIT MODEL � Margin Management - profit margins Financial Strategy � Asset Management - rate of asset turnover The Strategic Profit Model � Financial Leverage Management Margin Management (cont.) MARGIN MANAGEMENT � You can the net profit margin by : sales and � Net Profit Margin = Net Profit/Net Sales reducing ↓ expenses (wages, rent, selling � How much profit each dollar of sales generates expenses, interest, depreciation) � Net Profit Margin = Gross Margin - Total Expenses � You can also ↓ the COGS (invoice cost, freight � Gross Margin = Sales - COGS costs, discounts from vendor, etc.) � Info found in Income Statement ASSET MANAGEMENT Asset management (cont.) � Improve how productively the firm uses its resources � Info is taken from the Balance Sheet (with the exception of sales) � Asset Turnover (sales generated per dollar of assets) is of concern here � Asset turnover can be improved by sales or ↓ assets (like inventory, accounts receivable, or fixed assets) � Asset Turnover = Net Sales/Total Assets � Objective: Turn inventory into accounts receivable or � Asset Turnover of 1.5: Each dollar invested generates cash and back into inventory $1.50 in sales 1
Asset Management (cont.) � Accounts receivable choices : � Inventory Turnover = Net Sales / Avg. � Bank cards, Proprietary Cards (like Sears), or Private Inventory Label Credit Cards with 3rd party “factor” � Asset turnover is similar to inventory turnover but more encompassing � includes fixed and variable assets, not just level of average inventory RETURN ON ASSETS ROA (cont.) � ROA reflects both Margin Management and � ROA is used to evaluate the performance of Asset Management stores and used to evaluate managers � ROA = Net Profit Margin X Asset Turnover � Firms can get their return on assets in different ROA = (Net Profit/Net Sales) X (Net Sales/Total Assets) ways � Discounters have low profit margins but high turnover � Specialty stores have high profit margins but low � ROA = Net Profits/Total Assets turnover Improving ROA ROA (cont.) � Increase sales � lower prices, better advertising, minimize stockouts, � ROA can be compared across different types of control inventories firms � Control COGS � measures of how well a retailer is performing � monitor supplier’s prices and payment terms � take advantage of special discounts and trade deals, � Asset turnover and profit margins can’t be better credit terms compared across different types of retailers � opportunistic buying given retailers’ varying strategies � Control expenses � Control assets 2
FINANCIAL LEVERAGE Improving ROA MANAGEMENT � Control Expenses � Leverage Ratio = Total Assets/Owner’s Equity (Net � cut costs carefully Worth) � be careful of inadequate service or unqualified sales Net Worth = Total Assets - Total Liabilities help � Assuming debt allows a retailer to expand and grow � Control Assets � Quick response - stock should reflects demand � Financial Leverage positively affects % return on � Eliminate slow moving merchandise, prune brands stockholder’s equity and sizes Financial Constraints of Electronic RETURN ON NET WORTH Retailers � Cost of distribution centers and warehouses � RONW = ROA X Leverage Ratio � Discounts and price wars abound � Marketing consumes revenue (it costs money to advertise and draw people to your web site) � Costly to develop web sites, continuously improve them, and service them Financial hurdles (cont.) � Customer service costs more than expected � Fees/rents are high on portals like Yahoo � Rent and other marketing costs can run 65% of sales according to the Boston Consulting Group � Is the web just a catalog business with lower barriers to entry? Will margins get better? 3
Recommend
More recommend