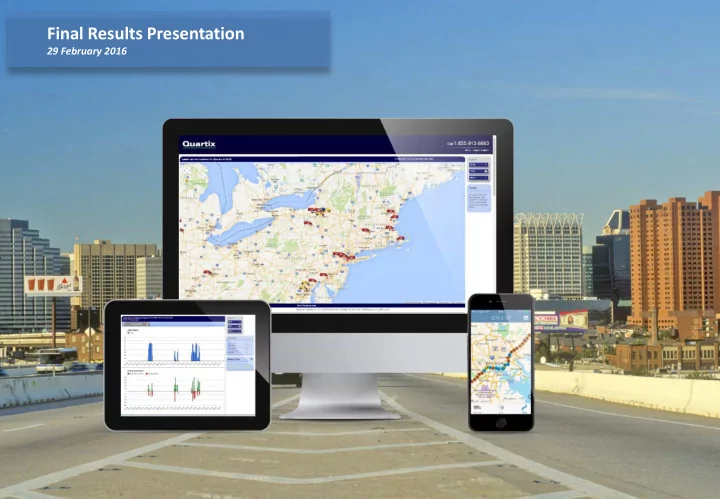

Final Results Presentation 29 February 2016
Financial 20 Revenue Results £m EBIT 15 Operating cash flow 10 5 yr CAGRs: 5 Revenue: +24% EBIT: +27% Operating 0 Cash flow: +39% 2011 2012 2013 2014 2015
Subscription Base 80,000 70,000 60,000 50,000 40,000 30,000 20,000 10,000 0,000 2001 2002 2003 2004 2005 2006 2007 2008 2009 2010 2011 2012 2013 2014 2015
KPIs 2015 2014 % change Fleet installations 21,518 16,355 31.6 Fleet subscription base (units) 73,744 59,765 23.4 Fleet customer base 7,849 6,342 22.6 Fleet attrition (annualised) (%) 11.3 9.4 Fleet invoiced recurring revenues (£’000) 11,828 9,816 20.4 Fleet revenues (£’000) 12,957 11,038 17.4 Insurance installations 57,295 32,842 74.5 Insurance revenues (£’000) 6,718 4,293 56.5
Recurring Revenues 12.0 2015 10.0 2014 £m 8.0 2013 6.0 2012 4.0 2011 The chart shows 2010 invoiced fleet rental 2009 2.0 and communications 2002 revenues segmented to 2008 0.0 by year of customer acquisition
Overview Year ended 31 st December - £’000 (except where stated) 2015 2014 % change Revenues Fleet 12,957 11,038 17.4 Insurance 6,718 4,293 56.5 Total 19,675 15,331 28.3 Gross profit 12,150 9,943 22.2 Gross margin 62% 65% Operating profit 6,045 4,885 23.7 Operating margin 31% 32% Net profit 5,014 4,032 24.4 Adjusted Earnings per share (p) 10.69 8.52 25.5 Adjusted cash generation from operations 6,781 5,523 22.8 Operating profit to operating cash conversion 112% 113%
Financial Results Dividends FCF up 20% to Free paid £5.4m cash flow (2014: 4.5m) 5.4 2.3 £m Net cash EPS up 25% to 10.69p 2014: 3.0 net debt per share Net cash: of £0.2m Proposed final £3.0m at dividend 0.2 4.0p per year end share
Dividend Policy £’000 Interim dividend: Less taxes paid 2.0p per share 6,781 1,092 Final dividend: 4.0p per share Less interim dividend 50% 2,845 940 The current policy is 1,905 to pay out 50% of free cash flow (defined as cash Cash flow Final generated from from dividend operations operations, less taxes)
Supplementary Dividend £’000 2015 year end example Year end cash balance 4,040 Year end final dividend 1,905 2,135 Year end cash balances Amount over £2m 135 in excess of £2m after the final dividend will Cash required for 2p per share 944 be paid as a supplementary No supplementary dividend for 2015 dividend, subject to minimum of 2p per share
“We have seen improved driving standards utilising the Quartix driving style reports, resulting in reduced vehicle incidents and an 18% improvement in fuel consumption.” Andrew Gibbons, Fleet CI Manager, Ginsters Ltd
“ Using the Quartix system we have reduced communication costs with our drivers by 50%. ” Arnaud Richter, Directeur Exploitation, SLTI
Fleet 21,516 Tracking 20,000 Units 16,337 15,000 10,000 32% growth 5,000 in new fleet installations 0 2014 2015
Fleet 80,000 73,744 Active vehicle Tracking subscriptions 60,000 40,000 29,991 Fleet base 20,000 5 year CAGR 20% 0 2011 2012 2013 2014 2015
Fleet UK £11.7m 62,655 15,566 5,960 6000 12 + 15% + 15% + 13% + 12% 15000 60000 £ m 10 50000 8 4000 10000 40000 6 30000 4 2000 5000 20000 2 10000 0 0 0 0 2014 2015 2014 2015 2014 2015 2014 2015 Revenue Subscriptions Installations Customers
Fleet France € 1.4m 7500 7,190 3,145 1,196 1.5 + 48% +38% + 52% + 34% € m 3000 1000 1.0 5000 2000 500 0.5 2500 1000 0.0 0 0 0 2014 2015 2014 2015 2014 2015 2014 2015 Revenue Subscriptions Installations Customers
Fleet USA $0.4m 3,179 2,805 693 3000 750 0.4 $ 3000 m 0.3 2000 500 2000 0.2 1000 250 1000 0.1 0.0 0 0 0 2014 2015 2014 2015 2014 2015 2014 2015 Revenue Subscriptions Installations Customers
Insurance Telematics 20% Estimated proportion of market by age 15% 10% Estimated market size 5% 250-300k per annum 0% 17 18 19 20 21 22 23 24 25 26 27
Insurance 7 Telematics 6.7 unit £m 57,024 6 s 5 4.3 4 32,842 3 Growth: 2 74% volume 1 56% revenue 0 2014 2015 2014 2015 Installations Revenue
Research and Development TCSV11 US network Temperature approvals Monitoring TCSV10 3G IFTA Quartix Web Reporting Services AP I iOS & SafeSpeed Android Apps Database
Summary and Outlook • Strong growth in subscriptions underpins recurring revenues in fleet • Good progress in all three fleet markets • Good profit growth despite increased investment in new markets, new installations and increased plc costs • Strong cash generation enables high returns to shareholders
Final Results Presentation Appendix: Introduction to Quartix
GPS GPRS
Operations Chicago Newtown Cambridge Leatherhead Bishop’s Waltham
“We have always found Quartix to be customer-focused and approachable. We look forward to continuing our partnership for the next 15 years .” Phil House, Director, Broadland Guarding Services Ltd.
Final Results Presentation 29 February 2016
Recommend
More recommend