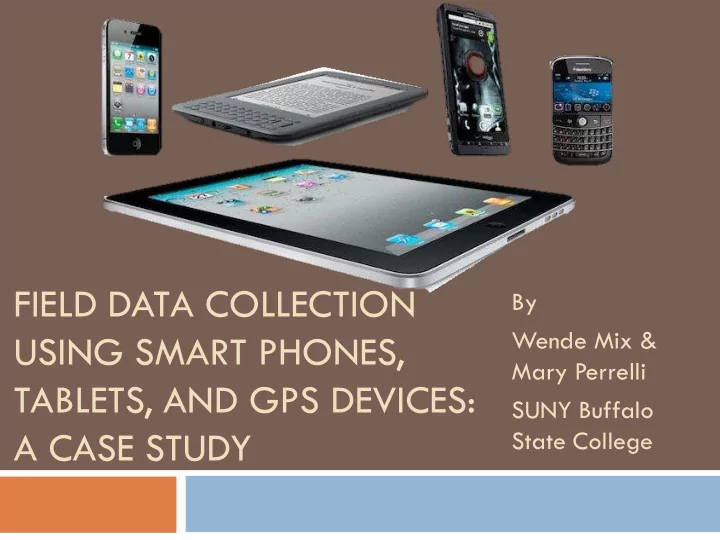

FIELD DATA COLLECTION By Wende Mix & USING SMART PHONES, Mary Perrelli TABLETS, AND GPS DEVICES: SUNY Buffalo A CASE STUDY State College
Outline Research Question Methodology Results Summary
Research Question Do different mobile spatial data collection devices impact spatial accuracy? The focus of this study is to address the question on which data collection approach consistently is more spatially accurate . Cost?
Research interests Type of features Visibility on satellite imagery (digital ortho-imagery) Accessibility of and Familiarity with Technology Online v Offline applications
Technology Used ArcGIS Online (subscription) Build a separate application for each data collection team. Use imagery basemap. WiFi connection required
Technology
Technology Tablet : IPad, Android Tablet IPod, SmartPhone MiFi for off-campus data collection Verizon Jetpack 4G LTE
Geodatabase with multiple Domains Zoom in upon touch
Geodatabase with Subtypes Keypad Text Entry
World Imagery Basemap World Imagery provides one meter or better satellite and aerial imagery in many parts of the world and lower resolution satellite imagery worldwide. The map includes NASA Blue Marble: Next Generation 500m resolution imagery at small scales (above 1:1,000,000), i-cubed 15m eSAT imagery at medium-to-large scales (down to 1:70,000) for the world, and USGS 15m Landsat imagery for Antarctica. The map features 0.3m resolution imagery in the continental United States and 0.6m resolution imagery in parts of Western Europe from Digital Globe. In other parts of the world, 1 meter resolution imagery is available from GeoEye IKONOS, i- cubed Nationwide Prime, Getmapping, AeroGRID, IGN Spain, and IGP Portugal. Additionally, imagery at different resolutions has been contributed by the GIS User Community. For more information on this map, including the terms of use, visit us online at http://goto.arcgisonline.com/maps/World_Imagery Credits Source: Esri, DigitalGlobe, GeoEye, i-cubed, USDA, USGS, AEX, Getmapping, Aerogrid, IGN, IGP , swisstopo, and the GIS User Community
CURRENCY ISSUES
Campus Locations 2 classes of students taking GEG 325 Maps and Mapmaking using GIS 10 locations on campus 1. American flag pole in the Union quad 2. Sign with the campus map on the south side of Bacon Hall 3. Tree #22 - 6th tree west of Elmwood in row closest to Rockwell Hall 4. Streetlight H2 - north side of Rockwell Rd on the center of Ketchum Hall 5. Stop sign in the westbound direction at the intersection of Rockwell and the entrance to C lot 6. Pine tree at the southeast corner of Newman Hall 7. Fire hydrant at the southwest corner of Newman Hall 8. Furthest east F-1 lot sign near Technology Bldg construction fencing 9. Streetlight G38A - Bengal walk on the exterior of the circle near the arena 10. Tree-like sculpture near northwest door of Cassety Hall Tablet or smartphone, and GPS Tablet Methods: Device GPS and Manual
Campus Locations Known feature locations collected manually using an IPod and using a Trimble GeoXT GPS Mean distance between Manual and GPS = 2.6 m.
GPS Stylus IPod GPS Satellite button
Average Distances to Nearest Point Nearest point Known Points Sample Size Manual GPS Method Manual 160 8.1m 9.2 m Device GPS 137 30.1m 30.5 m Garmin GPS 153 14 m 14.4 m Correct point Known Points Sample Size Manual GPS Method Manual 155 5.4 m 6.6 m Device GPS 128 26.6 m 27.3 m Garmin GPS 148 10.9 m 11.3 m
Average Distances to Correct Point H o : Mean Manual = Mean GPS H a : Mean Manual / Mean GPS Method z Z crit p Manual 1.04 1.96 0.30 Device GPS 0.22 1.96 0.83 Garmin GPS 0.23 1.96 0.77 Fail to Reject H o : Means are equal H o : Mean Manual Method(1) = Mean Manual Method(2) H a : Mean Manua l Method(1) / Mean Manual Method(2) Method Manual Device GPS Garmin GPS Manual 9.45, 1.96, 0 4.15, 1.96, 3.33E-05 Device GPS 6.69, 1.96, 2.24E-11 Garmin GPS Reject H o : Means are equal
City of Buffalo Streetlights 30,440 records
Elmwood Ave Streetlights
http://arcgis.com
BSC Streetlights
No points in COB data 2 points in COB data
Streetlights 12 of the 73 points collected using a tablet are more than 18 meters from the nearest COB streetlight. In other words, 12 locations with are streetlights were not included in COB database. Mean distance between remaining 61 pairs is 2.8 meters. 82% are within 3.5 meters of the nearest COB point
Invisible Storm Drains!
Storm drains – Wheatfield, NY 49 points captured in 30 minutes without leaving the car. Two captured points not in County (GPS) dataset Average distance between tablet captured points and County (GPS) points = 6.24 meters Maximum = 18 m 19% within 3 m 64% within 6 m
Summary Manual method using tablets and smart phones results in fairly consistent spatial accuracy May depend on skill/experience of data collector Device GPS only reliable to get you within the vicinity of your location Handheld GPS also subject to human error.
Contact Information Wende Mix, Ph.D. mixwa@buffalostate.edu 716 – 878-3027 Mary Perrelli perrelmf@buffalostate.edu 716 – 878-3699
Recommend
More recommend