
FEBRUARY 2020 FINANCIAL RESULTS Piet Mouton PSG Group CEO 1 - PowerPoint PPT Presentation
FEBRUARY 2020 FINANCIAL RESULTS Piet Mouton PSG Group CEO 1 Contents 1. Covid-19 PSG Group response Economic impact 2. Overview Group structure Investment philosophy 3. FY20 PSG Group financial results 4. FY20
FEBRUARY 2020 FINANCIAL RESULTS Piet Mouton PSG Group CEO 1
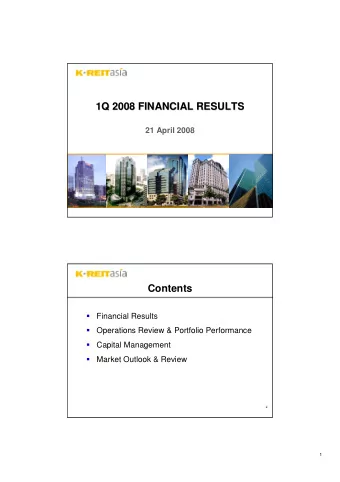
Contents 1. Covid-19 • PSG Group response • Economic impact 2. Overview • Group structure Investment philosophy • 3. FY20 PSG Group financial results 4. FY20 Investees’ financial results 5. PSG Alpha Appendices 2
Covid-19 PSG Group Covid-19 response: Way of work • PSG Group’s employees are all working remotely • Collaborated with investees to prepare plans in response to Covid-19 • Scenario analyses/stress testing Capital • Assess the capital requirements of all investees • Assess PSG Group’s liquidity position to be able to support investees if needed Operations • PSG Group continues to pay employees and suppliers 3
Covid-19 (cont.) Major negative impact of Covid-19 on the economy: Phase 1: National lockdown Negative impact on the economy correlated to duration of the • lockdown • Socio-economic impact on low income households in particular Phase 2: Post national lockdown Increase in unemployment • • Collapse of SMEs • Economic stimuli needed for businesses • Increase in social welfare spend Phase 3: Long-term impact • Severe contraction in GDP • Significant erosion of SA’s tax base • Continued social distancing negatively impacting › Tourism › Hospitality 4
Overview – Group structure Market Cap*: R31bn 30.7% 55.4% 60.5% 49.0% 43.8% 98.1% *Market capitalisation as at 17 April 2020 5 5
Overview – Investment philosophy: early-stage investing New investments should be in large markets: High-growth companies should have stronger balance sheets and • › Banking make limited use of debt • Management cannot simultaneously focus on high-growth › Energy (J-curve) investment opportunities and servicing debt: › Education › Loss of focus and conservatism If successful, the returns should be Window to capture the market • substantial Large inefficient incumbents: › “Free” services (Education and Energy) Fragmented: › IFAs › Retirement villages Best management teams: › Think different Best operating models: › Service › Pricing › Experience 6
FY20 PSG Group financial results
Sum-of-the-parts (SOTP) – 10-year view 28 Feb 10 29 Feb 20 SOTP 28 FEB 2010 Other Asset/(liability) Rm Rm 13.5% Capitec* 2,367 46,130 PSG Konsult* 948 6,399 Zeder Zeder* 742 3,173 Capitec 13.1% 41.9% PSG Alpha 834 3,618 Stadio* 649 Other investments** 834 2,969 PSG Alpha Curro* 2,604 14.8% Dipeo** Other assets 761 879 PSG Konsult Cash^ 76 16.8% Pref investments and loans receivable^ 542 PSG Corporate ++ 361 SOTP 29 FEB 2020 Other^ 324 337 Other Zeder PSG Alpha 1.4% 5.1% Total assets 5,652 62,803 5.8% Perpetual pref funding* (541) (1,463) Curro Other debt^ (539) (1,020) 4.1% Total SOTP value 4,572 60,320 PSG Konsult Shares in issue (net of treasury shares) (m) 171.9 218.2 Capitec 10.2% 73.5% SOTP value per share (R) 26.60 276.43 Share price (R) 22.05 186.60 * Listed on the JSE Ltd ** SOTP value ++ Valuation ^ Carrying value Note: PSG's live SOTP containing further information is available at www.psggroup.co.za SOTP per share 26% CAGR 8
SOTP – as at 17 Apr 2020 29 Feb 2020 17 Apr 2020 Asset/(liability) Rm Change Rm Capitec 46,130 (30.0%) 32,282 PSG Konsult 6,399 (2.5%) 6,237 PSG Alpha 3,618 (2.7%) 3,520 Stadio 649 (35.3%) 420 Other investments 2,969 4.4% 3,100 Zeder 3,173 (0.5%) 3,158 Curro 2,604 (15.3%) 2,205 Dipeo Other assets 879 (12.1%) 773 Cash 187 (1.6%) 184 Pref investments and loans receivable 542 (6.1%) 509 Other 150 (46.7%) 80 Total assets 62,803 (23.3%) 48,175 Perpetual pref funding (1,463) 27.4% (1,062) On 28 April 2020, through receipt of the Zeder special dividend of Other debt (1,020) 1.1% (1,031) R2.30 per share, our cash will increase by R1.7bn and our share of Total SOTP value 60,320 (23.6%) 46,082 Zeder’s market cap is likely to reduce with a similar amount. Shares in issue (net of treasury shares ) (m) 218.2 218.2 SOTP value per share (R) 276.43 (23.6%) 211.18 Share price (R) 186.60 (24.5%) 140.84 JSE All Share Index decreased by 3.7% between 29 Feb 2020 and 17 April 2020 9
PSG Group share price vs SOTP value per share Discount PSG Group share price vs SOTP value per share (29 Feb 2020) 350 Latest discount ~32% 12-month average discount 300 ~23% 276.43 250 Liquidity (per annum) 200 186.60 Feb 2020 49% 150 Feb 2019 47% 100 Feb 2018 69% 50 Feb 2017 30% Feb 2016 50% - Feb 10 Feb 11 Feb 12 Feb 13 Feb 14 Feb 15 Feb 16 Feb 17 Feb 18 Feb 19 Feb 20 Feb 2015 17% SOTP value (R) Share price (R) Feb 2014 10% 10
Discount to SOTP – Reasons Reasons for the discount: • Capitec success • Investment holding companies have generally fallen out of favour Too many listed entry points into PSG Group: • › Investors can construct their own portfolio • PSG Group has struggled to get meaningful traction with its early-stage PSG Alpha investments › Low economic growth the past decade › Scored own goals It is our intention to unlock the discount as far as reasonably possible when opportune: • Share-buybacks unlikely to form part of the strategy 11
Is PSG Group just a Capitec proxy? Capitec: • Capitec is the most successful business created in South Africa the last 20 years • Shareholders must remember that we unbundled Capitec in 2003 and subsequently reacquired the shares in the market to the benefit of PSG Group shareholders 10-year performance to end of Feb 2020: • We analyse the SOTP per share performance, because you cannot simply allocate the discount and the debt to other investments (non-Capitec) and conclude that these investments have delivered negative returns • 10-year CAGR on a “PSG” per share basis (excludes dividends) › Capitec: 34% › Other assets: 16% (all surplus cash included in this return) › PSG Group SOTP: 26% › JSE All Share Index: 7% Capitec has contributed significantly to our success; however, our other assets have also materially outperformed the JSE over the last 10 years 12
PSG Group dividend PSG Group dividend distribution vs the dividend income PSG Group earned from its JSE-listed investee companies (FY15 - FY19) 1 200 120.00% 996 100% 1 000 100.00% 903 90% 816 83% 81% Dividend (Rm) 800 79% 80.00% 649 621 600 522 60.00% 444 409 374 400 40.00% 290 166 146 200 124 20.00% 104 95 80 82 82 47 27 27 - 0.00% 2015 2016 2017 2018 2019 PSG Group Capitec PSG Konsult Zeder Curro Total dividend income from the JSE-listed investee companies as a % of the PSG Group dividend distribution PSG Group dividend distribution: • FY16 to FY19 dividend distributions were significantly more than the dividend income earned from the PSG Group JSE-listed investee companies PSG Group dividend policy: Distribute up to 100% of available free cash flow • FY20 PSG Group dividend distribution: • The SA Reserve Bank Guidance Note 4/2020 • Final dividend of 75 cents per share 13
Gearing and interest cover – Feb 2020 Gearing* (based on SOTP value) Gearing* (based on consolidated B/S NAV) Interest cover** 13.0% 4.1% 3.1x *Incl. perpetual pref funding at MV **Calculated using free cash flow • PSG Group is conservatively geared • Has significant capacity for further debt if needed 14
Recurring earnings 28 Feb 18 28 Feb 19 Change 29 Feb 20 Rm Rm % Rm Capitec 1,369 1,625 1,927 PSG Konsult 348 361 389 PSG Alpha 172 216 270 Zeder 205 207 246 Curro 110 137 117 Dipeo (56) (29) (36) PSG Corporate (7) (45) (29) Other (mainly pref div income) 136 84 126 Recurring earnings before funding 2,277 2,556 18 3,010 Funding (net of interest income) (135) (199) (216) Recurring earnings 2,142 2,357 19 2,794 15
Earnings and dividend per share 28 Feb 18 28 Feb 19 Change 29 Feb 20 Rm Rm % Rm Recurring earnings 2,142 2,357 19 2,794 Non-recurring items (186) (163) (211) Headline earnings 1,956 2,194 18 2,583 Non-headline items (42) (268) (121) Attributable earnings 1,914 1,926 28 2,462 Earnings per share (R) - Recurring 9.94 10.86 18 12.81 - Headline 9.08 10.11 17 11.84 - Attributable 8.88 8.88 27* 11.29 Dividend per share (R) 4.15 4.56 (48)** 2.39 *Attributable earnings per share increased by a higher margin than recurring earnings and headline earnings per share mainly due to Zeder’s non- headline reversal of an impairment loss recognised in respect of its investment in Pioneer Foods at 28 Feb 2019 following a recovery in its share price **The 48% decline in dividend per share is attributable to Capitec complying with the SA Reserve Bank’s Guidance Note 4/2020, thereby not having declared a final dividend i.r.o. FY20 16
Total return index (TRI) – Feb 2020 PSG Group Companies ’ TRI vs. JSE All Share TRI* 60.0% 49.1% 50.0% 40.8% 40.0% 33.4% 27.6% 30.0% 20.0% 13.0% 12.8% 12.2% 10.7% 9.1% 7.7% 10.0% - PSG** PSG Konsult Curro*** Zeder Capitec 17 Nov 1995 11 Apr 2005 1 Jun 2009 1 Dec 2006 18 Feb 2002 Company TRI* JSE All Share TRI* *Measured since the respective dates noted until 29 Feb 2020 **Capitec unbundling in Nov 2003 treated as a dividend ***Stadio unbundling in Oct 2017 treated as if Curro shareholders retained such Stadio shares received 17
FY20 Investees’ financial results
Recommend


![PARISH OF ANNERLEY EKIBIN The Presentation of the Lord [OF] & Purification of the Blessed](https://c.sambuz.com/652195/parish-of-annerley-ekibin-s.webp)


More recommend
Explore More Topics
Stay informed with curated content and fresh updates.