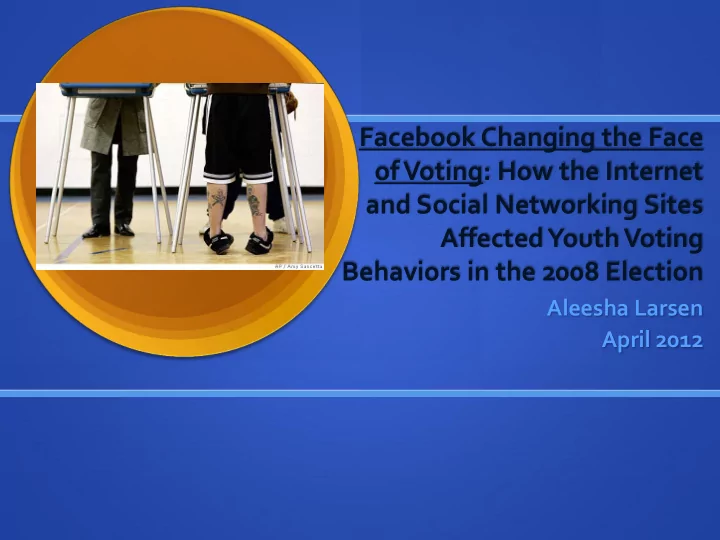

Facebook Changing the Face of Voting: How the Internet and Social Networking Sites Affected Youth Voting Behaviors in the 2008 Election Aleesha Larsen April 2012
So What? Voting behavior is always being researched In 2006 there were 42 million eligible voters aged 18-29 2008 saw record numbers of youth turnout “…mobilizing young voters creates a larger, more vibrant voting base in the long-run, re-energizing our nation’s democracy.” (youth mobilization tactics)
Why I care Obama carried the youth vote in 2008 and some believe the youth are the ones who won him the election. What made him so appealing to young voters? I believe it was his campaign’s superior use of the Internet and Social Networking sites.
Literature Review: Youth Results in 2008 Von Drehle, 2008: The Year of the Youth Vote Milner, 2010: online youth civic engagement? CIRCLE
Internet Effects Tolbert & McNeal, 2003: Internet access=more voting Bachman, et. al., 2010: narrowing participation gap Smith, 2009: Internet use for 2008 campaign
Data PEW Internet and American Life Project (Princeton Survey Research Associates) “November 2008 Post -Election Tracking Survey”
Vote for Obama Vote for McCain 74.7% 25.3% 18-24 (357) (121) 59.6% 40.4% 25-34 (482) (327) 52.9% 47.1% 35-44 (490) (436) Relationship between 57.3% 42.7% 45-54 (553) (412) Age, Political News 59.7% 40.3% 55-64 (448) (302) Source, and 2008 Vote 65+ 52.8% 47.2% (440) (394) Chi-square (age) = 75.853 Internet 55.9% 44.1% Asymp. Sig. (2-sided) = .000 as main Lambda (age) = .000 (386) (304) news source Chi-square (Internet) = Other 1.854 58.4% 41.6% main Asymp. Sig. (2-sided) = .173 (2401) (1710) news Lambda (Internet) = .000 source
Relationship between 18-24 25-34 35-44 45-54 55-64 65+ Social Network Use and Age 76% 46.5% 81.8% 59.5% 100% 100% SNS user (98) (58) (54) (22) (14) (5) Chi-square (18-24 SNS user) =.767 Asymp. Sig. (2-sided) = .381 Lambda (18-24 SNS user) = .000 71.8% 74% 55.9% 59.8% 78.8% 18.2% Not Chi-square (total SNS user) = .002 user (191) (225) (147) (79) (41) (2) Asymp. Sig. (2-sided) = .966 Lambda (total SNS user) = .000 Chi-square (18-24 SNS post) = 80.9% 56.9% 73.7% 60.6% 84.2% 13.153 SNS post (144) (78) (70) (20) (16) Asymp. Sig. (2-sided) = .000 Lambda (18-24 SNS post) = .000 Chi-square (total SNS post) =8.224 Asymp. Sig. (2-sided) = .004 63.6% 67.9% 54.4% 59.5% 83% 46.7% No Lambda (total SNS post) = .000 post (110) (171) (99) (72) (39) (7)
Logistic Regression Vote for Obama by Age and Vote for Obama by Age Internet News Source Model estimates and model summary: Logged odds (vote for Model estimate and model summary: Logged odds (vote for Obama in 2008) = a + b1 (age) + b2 (Internet news source) Obama in 2008) = a+b(age) Percentage Percentage Model Odds Model Odds Coefficient Significance Coefficient Significance change in change in estimates Ratio estimates Ratio odds odds Constant .835 Constant .768 Age .000 -.010 .990 -1% .000 Age -.009 .991 -.9% Internet . 016 -.205 .815 -18.5% news Model Value Significance source summary Significance Model Value Change in summary 32.727 .000 -2 log Change in likelihood 38.524 . 000 -2 log likelihood Cox-Snell .007 Cox-Snell R-square .008 R-square Nagelkerke Nagelkerke .009 .011 R-square R-square
Percentage Model Odds Coefficient Significance change in estimates Ratio odds Constant .125 Age .006 .324 1.006 .6% Black non- 3.634 .000 37.870 3,687% Hispanic Student .309 .065 1.362 36.2% 2007 income -.140 .000 .870 -13% High School .793 .009 2.210 121% Logistic education Some .715 .016 2.043 104.3% College education Regression Beyond 1.111 .000 3.038 203.8% College education Internet .183 .232 1.200 20% news source SNS user -.231 .126 .794 -20.6% Vote for Obama, News Source Model Value Significance and Internet Use against summary Change in - Control Variables 145.613 .000 2 log likelihood Cox-Snell .115 R-square Nagelkerke .158 R-square
What’s next? Romano, 2012 Milner, 2010 Peters, 2012
Recommend
More recommend