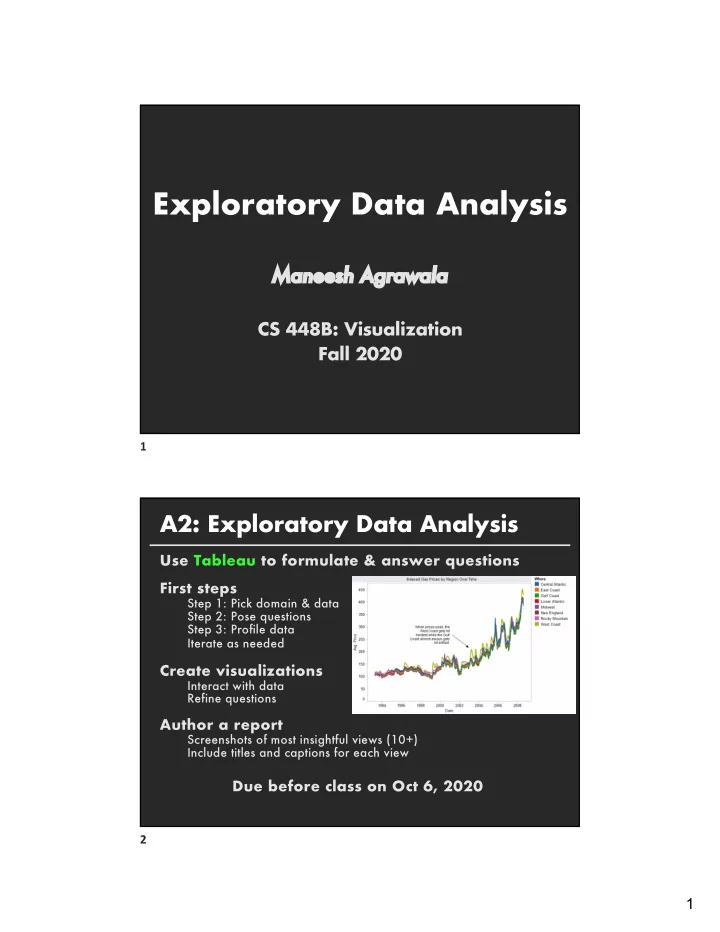

Exploratory Data Analysis Ma Maneesh Agrawala CS 448B: Visualization Fall 2020 1 A2: Exploratory Data Analysis Use Tableau to formulate & answer questions First steps Step 1: Pick domain & data Step 2: Pose questions Step 3: Profile data Iterate as needed Create visualizations Interact with data Refine questions Author a report Screenshots of most insightful views (10+) Include titles and captions for each view Due before class on Oct 6, 2020 2 1
Exploratory Data Analysis 3 The Rise of Statistics (1900-1950s) Rise of formal methods in statistics and social science — Fisher, Pearson, … Little innovation in graphical methods A period of application and popularization Graphical methods enter textbooks, curricula, and mainstream use 4 2
5 Four major influences act on data analysis today: 1. Formal theories of statistics 2. Accelerating developments in computers and display devices 3. More and larger bodies of data 4. Emphasis on quantification in many disciplines The Future of Data Analysis, John W. Tukey 1962 6 3
The last few decades have seen the rise of formal theories of statistics, "legitimizing" variation by confining it by assumption to random sampling, often assumed to involve tightly specified distributions, and restoring the appearance of security by emphasizing narrowly optimized techniques and claiming to make statements with "known" probabilities of error. The Future of Data Analysis, John W. Tukey 1962 7 While some of the influences of statistical theory on data analysis have been helpful, others have not. The Future of Data Analysis, John W. Tukey 1962 8 4
Exposure , the effective laying open of the data to display the unanticipated, is to us a major portion of data analysis. Formal statistics has given almost no guidance to exposure; indeed, it is not clear how the informality and flexibility appropriate to the exploratory character of exposure can be fitted into any of the structures of formal statistics so far proposed. The Future of Data Analysis, John W. Tukey 1962 9 Nothing - not the careful logic of mathematics, not statistical models and theories, not the awesome arithmetic power of modern computers - nothing can substitute here for the flexibility of the informed human mind . Accordingly, both approaches and techniques need to be structured so as to facilitate human involvement and intervention. The Future of Data Analysis, John W. Tukey 1962 10 5
Topics Data Wrangling Effectiveness of antibiotics Intro to Tableau 13 Data Wrangling 14 6
15 16 7
Data “Wrangling” One often needs to manipulate data prior to analysis. Tasks include reformatting, cleaning, quality assessment, and integration Some approaches: Writing custom scripts Manual manipulation in spreadsheets Trifacta Wrangler: http://trifacta.com/products/wrangler/ Open Refine: http://openrefine.org 17 How to gauge the quality of a visualization? “ The first sign that a visualization is good is that it shows you a problem in your data… …every successful visualization that I've been involved with has had this stage where you realize, "Oh my God, this data is not what I thought it would be!" So already, you've discovered something. ” - Martin Wattenberg 18 8
19 Node-link 21 9
Matrix 22 Matrix 23 10
Visualize Friends by School? Berkeley ||||||||||||||||||||||||||||||| Cornell |||| Harvard ||||||||| Harvard University ||||||| Stanford |||||||||||||||||||| Stanford University |||||||||| UC Berkeley ||||||||||||||||||||| UC Davis |||||||||| Univ. of California at Berkeley ||||||||||||||| Univ. of California, Berkeley |||||||||||||||||| Univ. of California, Davis ||| 24 Data Quality Hurdles Missing Data no measurements, redacted, …? Erroneous Values misspelling, outliers, …? Type Conversion e.g., zip code to lat-lon Entity Resolution diff. values for the same thing? Data Integration effort/errors when combining data LESSON: Anticipate problems with your data. LE Many research problems around these issues! 25 11
Analysis Example: Effectiveness of Antibiotics 35 Antibiotic Effectiveness: The Data Genus of Bacteria String Species of Bacteria String Antibiotic Applied String Gram-Staining Pos / Neg Min. Inhibitory Concent. (g) Number Collected prior to 1951 36 12
What questions might we ask? 37 Will Burtin, 1951 How do the drugs compare? 38 13
Will Burtin, 1951 Radius: 1/log(MIC) Bar Color: Antibiotic Background Color: Gram Staining 39 Do bacteria group by antibiotic resistance? Not a streptococcus! (realized ~30 yrs later) Really a streptococcus! (realized ~20 yrs later) Wainer & Lysen American Scientist , 2009 40 14
How do the bacteria group w.r.t. resistance? Do different drugs correlate? Wainer & Lysen American Scientist , 2009 41 Lessons Exploratory Process 1 Construct graphics to address questions 2 Inspect “ answer ” and assess new questions 3 Repeat! Transform the data appropriately (e.g., invert, log) “ Show data variation, not design variation ” -Tufte 42 15
Tableau / Polaris 77 Tableau Research at Stanford: “ Polaris ” by Stolte, Tang & Hanrahan. 78 16
Tableau Encodings Data Display Data Model 79 Polaris/Tableau Approach Insight: simultaneously specify both database queries and visualization Choose data, then visualization, not vice versa Use smart defaults for visual encodings Can also suggest more encodings upon request (ShowMe – Like APT) 80 17
Dataset Federal Elections Commission Receipts I Every Congressional Candidate from 1996 to 2002 I 4 Election Cycles I 9216 Candidacies I 81 Data Set Schema I Year (Qi) I Candidate Code (N) I Candidate Name (N) I Incumbent / Challenger / Open-Seat (N) I Party Code (N) [1=Dem,2=Rep,3=Other] I Party Name (N) I Total Receipts (Qr) I State (N) I District (N) This is a subset of the larger data set available from the FEC, I but should be sufficient for the demo 82 18
Hypotheses? What might we learn from this data? 83 Hypotheses? What might we learn from this data? Have receipts increased over time? I Do democrats or republicans spend more? I Candidates from which state spend the most money? I Tableau Demo 84 19
Specifying Table Configurations Operands are names of database fields Each operand interpreted as a set {…} Data is either O or Q and treated differently Three operators: concatenation (+) cross product (x) nest (/) 85 86 20
87 88 21
89 90 22
91 23
Recommend
More recommend