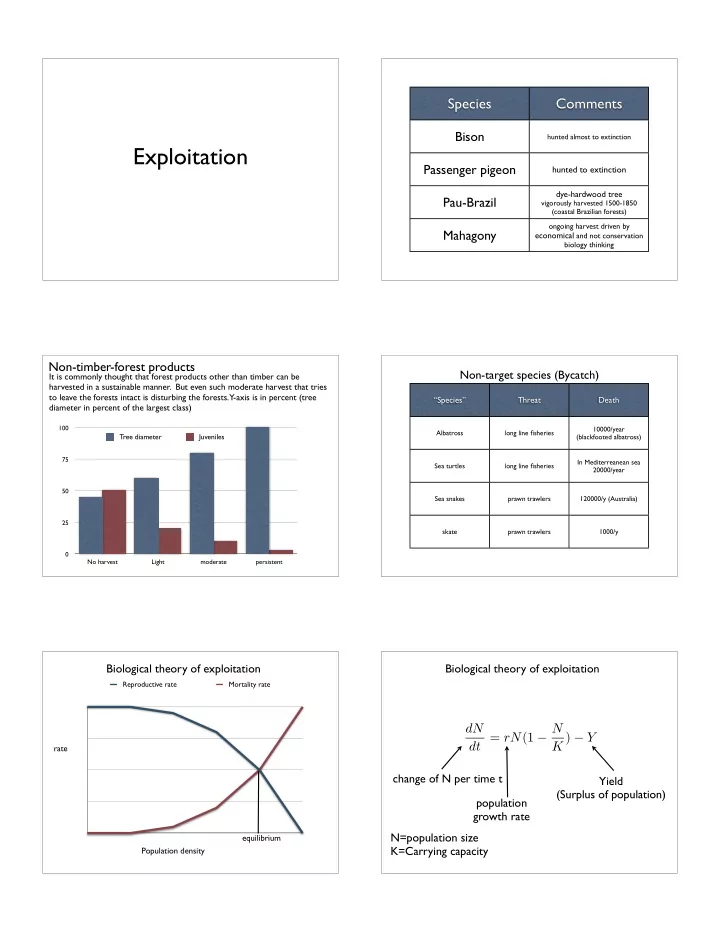

Species Comments Bison hunted almost to extinction Exploitation Passenger pigeon hunted to extinction dye-hardwood tree Pau-Brazil vigorously harvested 1500-1850 (coastal Brazilian forests) ongoing harvest driven by Mahagony economical and not conservation biology thinking Non-timber-forest products Non-target species (Bycatch) It is commonly thought that forest products other than timber can be harvested in a sustainable manner. But even such moderate harvest that tries to leave the forests intact is disturbing the forests. Y-axis is in percent (tree “Species” Threat Death diameter in percent of the largest class) 100 10000/year Albatross long line fisheries Tree diameter Juveniles (blackfooted albatross) 75 In Mediterreanean sea Sea turtles long line fisheries 20000/year 50 Sea snakes prawn trawlers 120000/y (Australia) 25 skate prawn trawlers 1000/y 0 No harvest Light moderate persistent Biological theory of exploitation Biological theory of exploitation Reproductive rate Mortality rate dN dt = rN (1 − N K ) − Y rate change of N per time t Yield (Surplus of population) population growth rate N=population size equilibrium K=Carrying capacity Population density
Solving the equation yields this yield curve • Yield is the population surplus that can be Yield removed sustainably. maximum sustainable yield • The logistic growth function can be solved for Y and so we can get the surplus for known K and r. 0 K 50% Population size Comparison of different yields Stability of yield in a constant quota system • Red: yield is higher than maximum sustainable yield: population goes extinct Yield • Yellow: maximum sustainable yield: unstable equilibrium, when actual N 0 N 0 = 700 = 700 N 0 = 700 population is smaller than the 50% population will go extinct, if population is r = 0 . 4 r = 0 . 4 r = 0 . 4 bigger than the 50% then it will approach K K = 1000 = 1000 K = 1000 50%. Y = 100 Y = 50 Y = 105 • Stable at K/ 2 Stable at K/ 2 UNSTABLE = 500 = 853 Green: two equilibria, only the upper (to the right) is stable and desirable. Harvest close to the carrying capacity can be sustainable. 0 K 50% maximal sustainable yield dN dt = rN (1 − N for this example is 100 Population size K ) − Y (per generation) Constant effort Stability of yield in a constant effort system Yield Effort Y = EN Yield • Red: very high effort, unstable EN = rN (1 − N • Yellow: maximum sustainable yield with K ) medium effort, stable • Green: low effort [right], high effort [left]. both are stable but low effort is N = K (1 − E preferrable with same yield, but population r ) needs to be near carrying capacity. 0 K 50% Population size
Effort and Cost Tragedy of the commons • When many share a resource, the resource is at strong risk Yield • Yield (Ym) is maximized at to get depleted (= species goes extinct) because the Em, but gain (the distance between the black and the red economical strategy is to get more than the others curve is no maximal. (=maximize gain). Of course this strategy does not work for Ym conservation strategies. With protected or partition • Gain is maximized with effort Yb Eb, much less effort but almost resources typically they are not depleted in the same manner. Cost same yield as with Em . Yc • We see this problem in hunting/fishing but also on grazing on • Yield (Yc) and cost are the same there is no gain. public land. Gain = Yield-Cost Ec Em Low Eb High Effort
Recommend
More recommend