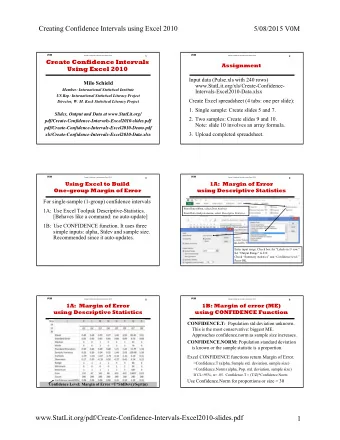
Estimating parameters 5.3 Confidence Intervals 5.4 Sample Variance - PowerPoint PPT Presentation
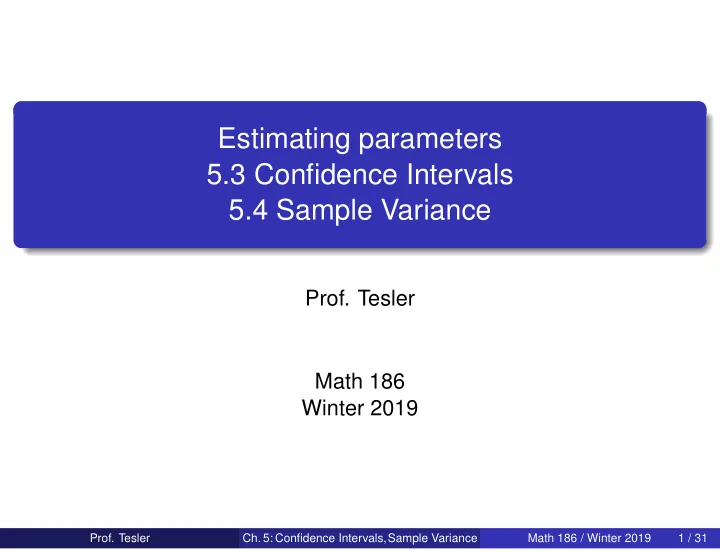
Estimating parameters 5.3 Confidence Intervals 5.4 Sample Variance Prof. Tesler Math 186 Winter 2019 Prof. Tesler Ch. 5: Confidence Intervals,Sample Variance Math 186 / Winter 2019 1 / 31 Estimating parameters of the normal distribution (
Estimating parameters 5.3 Confidence Intervals 5.4 Sample Variance Prof. Tesler Math 186 Winter 2019 Prof. Tesler Ch. 5: Confidence Intervals,Sample Variance Math 186 / Winter 2019 1 / 31
Estimating parameters of the normal distribution ( µ , σ ) or the binomial distribution ( p ) from data We will assume throughout that the SAT math test was designed to have a normal distribution. Secretly, µ = 500 and σ = 100 , but we don’t know those are the values so we want to estimate them from data. Chapter 5.3: Pretend we know σ but not µ and we want to estimate µ from experimental data. Chapter 5.4: Estimate both µ and σ from experimental data. Prof. Tesler Ch. 5: Confidence Intervals,Sample Variance Math 186 / Winter 2019 2 / 31
5.3 Estimating parameters from data Basic experiment Sample n random students from the whole population of SAT 1 takers. The scores of these students are x 1 , . . . , x n . Compute the sample mean of these scores: 2 x = x 1 + · · · + x n m = ¯ n The sample mean is a point estimate of µ ; it just gives one number, without an indication of how far away it might be from µ . Repeat the above with many independent samples, getting 3 different sample means each time. The long-term average of the sample means will be approximately � X 1 + ··· + X n � = n µ = µ + ··· + µ E ( X ) = E n = µ n n These estimates will be distributed with variance Var ( X ) = σ 2 / n . Prof. Tesler Ch. 5: Confidence Intervals,Sample Variance Math 186 / Winter 2019 3 / 31
Sample data Trial # m = ¯ x 1 x 2 x 3 x 4 x 5 x 6 x 1 720 490 660 520 390 390 528.33 2 380 260 390 630 540 440 440.00 3 800 450 580 520 650 390 565.00 4 510 370 530 290 460 540 450.00 5 580 500 540 540 340 340 473.33 6 500 490 480 550 390 450 476.67 7 530 680 540 510 520 590 561.67 8 480 600 520 600 520 390 518.33 9 340 520 500 650 400 530 490.00 10 460 450 500 360 600 440 468.33 11 540 520 360 500 520 640 513.33 12 440 420 610 530 490 570 510.00 13 520 570 430 320 650 540 505.00 14 560 380 440 610 680 460 521.67 15 460 590 350 470 420 740 505.00 16 430 490 370 350 360 470 411.67 17 570 610 460 410 550 510 518.33 18 380 540 570 400 360 500 458.33 19 410 730 480 600 270 320 468.33 20 490 390 450 610 320 440 450.00 Average 491.67 Prof. Tesler Ch. 5: Confidence Intervals,Sample Variance Math 186 / Winter 2019 4 / 31
Sample mean notation Variable names Actual distribution Point estimate from a sample (Greek letters) (Latin letters) X : random variable x 1 , . . . , x n : sample data µ : mean m or ¯ x : sample mean (or Y ; y 1 , . . . , y n ; ¯ y ) σ 2 : variance s 2 : sample variance σ : standard deviation s : sample standard deviation Lowercase/Uppercase Lowercase: Given specific numbers x 1 , . . . , x n , the sample mean evaluates to a number as well. Uppercase: We will study performing this computation repeatedly with different data, treating the data X 1 , . . . , X n as random variables. This makes the sample mean a random variable. x = x 1 + · · · + x n M = X = X 1 + · · · + X n m = ¯ n n Prof. Tesler Ch. 5: Confidence Intervals,Sample Variance Math 186 / Winter 2019 5 / 31
Sample data Trial # m = ¯ x 1 x 2 x 3 x 4 x 5 x 6 x µ = 500 , σ = 100 1 720 490 660 520 390 390 528.33 2 380 260 390 630 540 440 440.00 3 800 450 580 520 650 390 565.00 Are the sample means 4 510 370 530 290 460 540 450.00 close or far to the true 5 580 500 540 540 340 340 473.33 mean µ = 500 ? 6 500 490 480 550 390 450 476.67 7 530 680 540 510 520 590 561.67 What does “close” mean? 8 480 600 520 600 520 390 518.33 9 340 520 500 650 400 530 490.00 Within ± 0 . 01 ? 10 460 450 500 360 600 440 468.33 ± 1 ? 11 540 520 360 500 520 640 513.33 ± 10 ? 12 440 420 610 530 490 570 510.00 13 520 570 430 320 650 540 505.00 14 560 380 440 610 680 460 521.67 The scale for measuring 15 460 590 350 470 420 740 505.00 “closeness” is based on 16 430 490 370 350 360 470 411.67 standard deviations. 17 570 610 460 410 550 510 518.33 18 380 540 570 400 360 500 458.33 19 410 730 480 600 270 320 468.33 20 490 390 450 610 320 440 450.00 Average 491.67 Prof. Tesler Ch. 5: Confidence Intervals,Sample Variance Math 186 / Winter 2019 6 / 31
Z -scores How often is the sample mean “close” to the secret value of µ ? The sample mean is a random variable X with mean E ( X ) = µ and standard deviation SD ( X ) = σ/ √ n . So z = m − µ if we knew secret: = m − 500 σ/ √ n 100 / √ n Exclude the top 2 . 5 % and bottom 2 . 5 % of values of Z and regard the middle 95 % as “close.” So P (− z . 025 < Z < z . 025 ) = P (− 1 . 96 < Z < 1 . 96 ) = . 95 For m = 411 . 67 (one of the trials in our demo): z = 411 . 67 − 500 = − 88 . 33 40 . 82 = − 2 . 16 √ 100 / 6 which is outside of ± 1 . 96 , so m = 411 . 67 is “far” from µ = 500 . Prof. Tesler Ch. 5: Confidence Intervals,Sample Variance Math 186 / Winter 2019 7 / 31
Confidence intervals We will rearrange this equation to isolate µ : P (− 1 . 96 < Z < 1 . 96 ) = P (− 1 . 96 < M − µ σ/ √ n < 1 . 96 ) = . 95 Interpretation: in ≈ 95 % of the trials of this experiment, the value M = m satisfies m − µ − 1 . 96 < σ/ √ n < 1 . 96 Solve for bounds on µ from the upper limit on Z : m − µ m − µ < 1 . 96 σ m − 1 . 96 σ σ/ √ n < 1 . 96 √ n < µ ⇔ ⇔ √ n Notice the 1.96 turned into − 1 . 96 and we get a lower limit on µ . Also solve for an upper bound on µ from the lower limit on Z : m − µ − 1 . 96 σ µ < m + 1 . 96 σ − 1 . 96 < √ n < m − µ ⇔ ⇔ σ/ √ n √ n m − 1 . 96 σ √ n < µ < m + 1 . 96 σ Together, √ n Prof. Tesler Ch. 5: Confidence Intervals,Sample Variance Math 186 / Winter 2019 8 / 31
Confidence intervals In ≈ 95 % of the trials of this experiment, the value M = m satisfies m − 1 . 96 σ √ n < µ < m + 1 . 96 σ √ n So, ≈ 95 % of the time we perform this experiment, the true mean µ is in the interval � � m − 1 . 96 σ √ n , m + 1 . 96 σ √ n which is called a (two-sided) 95% confidence interval . For a 100 ( 1 − α ) % C.I., use ± z α/ 2 instead of ± 1 . 96 . Other commonly used percentages: For a 99 % confidence interval, use ± 2 . 58 instead of ± 1 . 96 . For a 90 % confidence interval, use ± 1 . 64 instead of ± 1 . 96 . For demo purposes: For a 75 % confidence interval, use ± 1 . 15 instead of ± 1 . 96 . Prof. Tesler Ch. 5: Confidence Intervals,Sample Variance Math 186 / Winter 2019 9 / 31
Confidence intervals Example: Six scores 380, 260, 390, 630, 540, 440 m = 380 + 260 + 390 + 630 + 540 + 440 Sample mean: = 440 6 σ : We assumed σ = 100 at the beginning √ n = ( 1 . 96 )( 100 ) 1 . 96 σ 95% CI half-width: ≈ 80 . 02 √ 6 95% CI: ( 440 − 80 . 02 , 440 + 80 . 02 ) = ( 359 . 98 , 520 . 02 ) Has the true mean, µ = 500 . √ n = ( 1 . 15 )( 100 ) 1 . 15 σ 75% CI half-width: ≈ 46 . 95 √ 6 75% CI: ( 440 − 46 . 95 , 440 + 46 . 95 ) = ( 393 . 05 , 486 . 95 ) Doesn’t have the true mean, µ = 500 . Prof. Tesler Ch. 5: Confidence Intervals,Sample Variance Math 186 / Winter 2019 10 / 31
Confidence intervals σ = 100 known, µ = 500 unknown, n = 6 points per trial, 20 trials Confidence intervals not containing point µ = 500 are marked *(393.05,486.95)* . Trial # m = ¯ 75% conf. int. 95% conf. int. x 1 x 2 x 3 x 4 x 5 x 6 x 1 720 490 660 520 390 390 528.33 (481.38,575.28) (448.32,608.35) 2 380 260 390 630 540 440 440.00 *(393.05,486.95)* (359.98,520.02) 3 800 450 580 520 650 390 565.00 *(518.05,611.95)* (484.98,645.02) 4 510 370 530 290 460 540 450.00 *(403.05,496.95)* (369.98,530.02) 5 580 500 540 540 340 340 473.33 (426.38,520.28) (393.32,553.35) 6 500 490 480 550 390 450 476.67 (429.72,523.62) (396.65,556.68) 7 530 680 540 510 520 590 561.67 *(514.72,608.62)* (481.65,641.68) 8 480 600 520 600 520 390 518.33 (471.38,565.28) (438.32,598.35) 9 340 520 500 650 400 530 490.00 (443.05,536.95) (409.98,570.02) 10 460 450 500 360 600 440 468.33 (421.38,515.28) (388.32,548.35) 11 540 520 360 500 520 640 513.33 (466.38,560.28) (433.32,593.35) 12 440 420 610 530 490 570 510.00 (463.05,556.95) (429.98,590.02) 13 520 570 430 320 650 540 505.00 (458.05,551.95) (424.98,585.02) 14 560 380 440 610 680 460 521.67 (474.72,568.62) (441.65,601.68) 15 460 590 350 470 420 740 505.00 (458.05,551.95) (424.98,585.02) 16 430 490 370 350 360 470 411.67 *(364.72,458.62)* *(331.65,491.68)* 17 570 610 460 410 550 510 518.33 (471.38,565.28) (438.32,598.35) 18 380 540 570 400 360 500 458.33 (411.38,505.28) (378.32,538.35) 19 410 730 480 600 270 320 468.33 (421.38,515.28) (388.32,548.35) 20 490 390 450 610 320 440 450.00 *(403.05,496.95)* (369.98,530.02) Prof. Tesler Ch. 5: Confidence Intervals,Sample Variance Math 186 / Winter 2019 11 / 31
Recommend


More recommend
Explore More Topics
Stay informed with curated content and fresh updates.