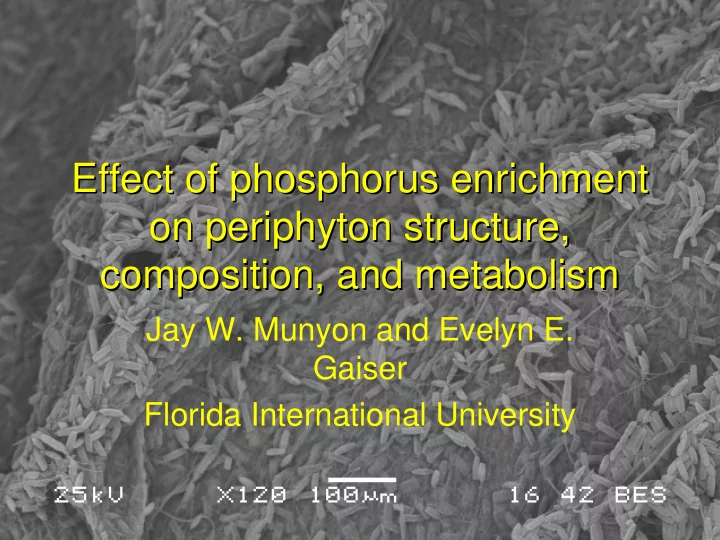

Effect of phosphorus enrichment Effect of phosphorus enrichment on periphyton structure, on periphyton structure, composition, and metabolism composition, and metabolism Jay W. Munyon and Evelyn E. Gaiser Florida International University
Everglades Periphyton • Benthic calcareous mats, floating mats, and epiphytic periphyton • Everglades periphyton varies spatially: – Nutrients, light, substrate, water depth • Long term data has shown changes in biomass in response to changes in water phosphorus levels
100 600 Season Periphyton AFDM (g m -2 ) Periphyton Cover (%) Dry 2005 75 400 Wet 2005 Dry 2006 50 Wet 2006 200 25 0 0 10 100 1000 10000 10 100 1000 10000 Periphyton Total Phosphorus (µg g -1 ) Periphyton Total Phosphorus (µg g -1 ) 10000 30 ppb Treatment 30 ppb Treatment Periphyton Biovolume (ml m -2 ) 8000 6000 4000 2000 0 10 100 1000 10000 Day 180 Day 180 Day 1 Day 1 Periphyton Total Phosphorus (µg g -1 ) Gaiser et al. 2006 L&O
Periphyton Matrix Blue greens with filaments of EPS (courtesy M. Gantar) CaCO 3 crystals in periphyton mat (courtesy M. Gantar) Encyonema with sheath/trail of EPS Diatoms leaving EPS trail on Utricularia purpurea EPS in periphyton mat
Hypotheses • As water TP increases: – System metabolism will change – EPS concentration will decrease – Abundance of mat-forming species will decrease – Periphyton biomass will decrease
Microcosm Experimental Setup
Methods • Treatments – Control Periphyton with filtered Everglades water – +P Periphyton with P-enriched filtered Everglades water – +A Periphyton pre-incubated in antimicrobial solution and filtered Everglades water – +P+A Periphyton pre-incubated in antimicrobial solution and P-enriched filtered Everglades water • +P = added ~2 µM (30ppb) P using Na 2 HPO 4 • +A = 250 mg D-cycloserine, 10 mg ampicillin, 10 mg tetracycline, 100 mg benomyl brought to 1 L with DI H 2 O
Methods
Methods • System was run for 7 days • Analyses – Metabolism – Extracellular Polysaccharide concentration (EPS) – Diatom abundances – Dry Weight – AFDM – Chl a – Water column TOC, TN, TP – Tissue C, N, P – Soft algae abundances – Bacteria
Methods • System was run for 7 days • Analyses – Metabolism – Extracellular Polysaccharide concentration (EPS) – Diatom abundances – Dry Weight – AFDM – Chl a – Water column TOC, TN, TP – Tissue C, N, P – Soft algae abundances – Bacteria
Hypothesis 1: System metabolism will change with increases in water TP Effect of Treatment on Respiration Respiration rates increased 0.8 Respiration (mg O 2 /g dry/day) with increasing 0.6 water TP 0.4 +A respiration Control rates differed 0.2 +P significantly 0 +A from control -0.2 rates +P+A -0.4 -0.6 -0.8 30 35 40 45 50 55 Water TP (ug/L)
Hypothesis 2: EPS concentration will decrease with increasing water TP Effect of Treatment on Extracellular Polysaccharide Concentration P enrichment significantly 80 increased EPS * 70 concentration 60 EPS (ug/g dry) 50 +A and +P+A showed no 40 30 significant 20 change 10 0 C +P +A +P+A Treatment
Hypothesis 3: Abundance of mat forming diatoms will decrease Diatom Relative Abundance NMDS Treatment • There were Before Control chamber effects Before +A Control as shown by the Control +P+A before run +P controls grouping +A out from the rest. • After running an Axis 2 indicator species analysis, we find that Nitzschia amphibia was an indicator P- enrichment Axis 1
Hypothesis 4: Periphyton biomass would decrease with increasing water TP Effect of Treatment on Periphyton Biomass Periphyton biomass 3 decreased Dry weight per chamber (g) significantly 2.5 with increased P * 2 +A and +P+A 1.5 showed no significant 1 changes 0.5 0 Control +P +A +P+A Treatment
Conclusions • As water TP increases: – Metabolism changed with increasing water TP – EPS concentration did not decrease in response to P- enrichment – Nitzschia amphibia abundance did increase as a result of enrichment, however running the experiment for longer may have elicited a stronger response – Periphyton biomass did decrease in response to phosphorus, however this decrease was ameliorated by addition of antimicrobials
Future Directions • More microcosm research needs to be performed with greater number of replicates for each treatment • Periphyton mats need to be collected from areas with known low phosphorus levels • We need to find a method to quantify bacteria in Everglades periphyton mat
Acknowledgements • Everglades National Park • Everglades Foundation Fellowship • SERC Christina Menendez Fellowship • FCE-LTER • Committee – Evelyn Gaiser, Joe Boyer, and Steve Oberbauer • Miro Gantar • The Periphyton Group • The countless people who helped me with this project
Hypothesis 1: System metabolism will change with increases in water TP Water column TP of Effect of Treatment on Gross Primary Production controls did not differ significantly from +P 0.4 Control GPP did not 0.3 differ significantly from GPP (mg O 2 /g dry/day) +P 0.2 Control 0.1 +A had lower TP than +P 0 control indicating -0.1 +A uptake from water -0.2 +P+A column -0.3 +P+A had lower TP -0.4 than +P indicating that -0.5 antimicrobials 30 35 40 45 50 55 treatment increased P uptake Water TP (ug/L) GPP increased significantly with increasing TP
Hypothesis 1: System metabolism will change with increases in water TP Effect of Treatment on Net Ecosystem Production NEP increased 0.08 with increasing 0.06 NEP (mg O 2 /g dry/day) water TP 0.04 Control 0.02 +A and +P NEP +P did not differ 0 significantly from -0.02 +A control NEP -0.04 +P+A -0.06 -0.08 -0.1 30 35 40 45 50 55 Water TP (ug/L)
Recommend
More recommend