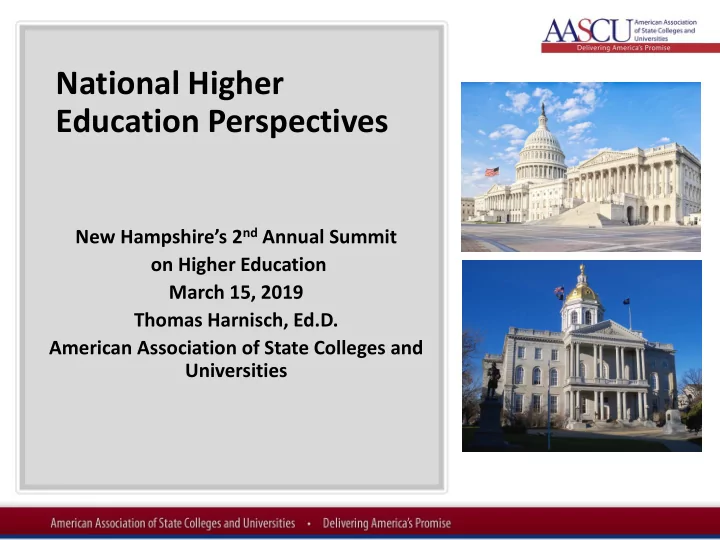

National Higher Education Perspectives New Hampshire’s 2 nd Annual Summit on Higher Education March 15, 2019 Thomas Harnisch, Ed.D. American Association of State Colleges and Universities
About AASCU • Association of 400 public college and university presidents • Represent regional public colleges and universities, including Keene State and USNH, the “workhorses” institutions of higher ed • Track and advocate on state and federal policy matters • Interests=affordability, excellence in undergraduate education, teacher education, diversity, student success
Observations • Despite a strong economy, higher ed remains pivotal to individual and community wellbeing. Not everyone is sharing in today’s prosperity. • NH---like other states---is undergoing profound economic/demographic shifts • New Hampshire remains at or near the bottom in college affordability. Need to invest in higher ed & provide need-based financial aid. • Federal policy could starkly change the higher ed landscape
• Longest economic expansion in The Best U.S. history of Times… • Low national & state unemployment rate---below 3% for over 2+ years in New Hampshire. Lowest unemployment in NH since 1988. • Highest wage growth in a decade • Strong GDP growth • Consumer confidence highest since 2000 in fall 2018
“We have an unusually large number of people in their prime working years who are not in the labor force. The United States has a lower labor force participation rate than almost every other advanced country.” The Worst of --- Fed Chair Times… Jerome Powell on 60 Minutes, March 10, 2019
Key forces cited by Fed Chair • Evolving technologies require rising skills, but educational attainment rates have not kept up. • Manufacturing base has deteriorated • Opioid crisis • Risk having a “lost generation”
The Worst of Times Source: The Atlantic , March 9, 2019
The Future • More jobs are going to require some form of a higher education in NH and elsewhere – Georgetown CEW: 68% of jobs in NH are going to require education beyond high school. 65% nationwide. NH goal to have 65% by 2025 – Without greater educational attainment, more people will be left behind – Incremental growth Source: Lumina Foundation, 2018
Demographic Decline Source: WICHE, 2016
Over 40% of NH Students Attend Public Colleges and Universities Source: Boston Federal Reserve, 2019
Making College Opportunities Affordable? Source: University of Pennsylvania Institute for Higher Education Research, 2016
Making College Opportunities Affordable? Source: University of Pennsylvania Institute for Higher Education Research, 2016
New Hampshire College Affordability Public 2-Year Colleges Source: The College Board, 2018
New Hampshire College Affordability Public 4-Year Colleges Source: The College Board, 2018
New Hampshire Financial Aid- Doesn’t Exist Source: NASSGAP Survey
Student Debt in NH-Near the Top Nationally Key factors: More expensive public colleges, higher rate of private college attendance, lack of eligibility for some federal aid programs Source: The Project on Student Debt, 2018
State Investment Near the Bottom Nationally Source: SHEEO, 2018
New Hampshire Public FTE Enrollment and educational appropriations per FTE, FY 45 $18,000 1992-2017 40 $16,000 • In 2018-19, NH had the 2 nd highest published in-state 35 $14,000 tuition and fees at four-year public colleges at $7,090 30 $10,755 $12,000 PUBLIC FTE ENROLLMENT (THOUSANDS) – Nat’l average: $3,660 $10,575 $10,477 $10,187 $10,691 $9,511 $9,884 DOLLARS PER FTE $8,633 $10,011 $10,019 25 $10,000 $11,629 $9,723 $7,798 $8,249 $11,483 $11,638 $8,246 $10,238 • In 2018-19, NH had the 2 nd highest published in-state $8,041 $11,018 $8,523 $9,596 $8,649 $11,463 $7,013 $10,965 20 $8,000 tuition and fees at four-year public colleges at $16,460 15 $6,000 – Nat’ average: $10,230 10 $4,000 $5,741 $5,106 $5,118 $5,156 $5,111 $4,989 $5,012 $4,868 $4,800 $4,698 $4,615 $4,607 $4,353 $4,274 $4,179 $4,084 $4,089 $4,117 $3,733 $3,474 $3,132 $3,041 $2,959 $2,786 5 $2,000 $2,017 $2,038 0 $0 1992 1993 1994 1995 1996 1997 1998 1999 2000 2001 2002 2003 2004 2005 2006 2007 2008 2009 2010 2011 2012 2013 2014 2015 2016 2017 NOTES: Data adjusted for inflation using the Higher Education Cost Adjustment (HECA). Full-time equivalent (FTE) enrollment equates student credit hours to full-time, academic year students, but excludes medical students. Educational appropriations are a measure of state and local support available for public higher education operating expenses including ARRA funds, and exclude appropriations for independent institutions, financial aid for students attending independent institutions, research, hospitals, and medical education. Net tuition revenue is calculated by taking the gross amount of tuition and fees, less state and institutional financial aid, tuition waivers or discounts, Educational Appropriations per FTE Net Tuition Revenue per FTE Public FTE Enrollment Source: SHEEO, 2018
State Funding • New Hampshire funding for higher ed near the bottom nationally • New Hampshire still 26% below pre-recession funding levels Source: Boston Federal Reserve, 2019
What are other states doing? • Reinvesting in institutions and state financial aid, with tuition caps and tuition freezes • Discussing non-tuition costs, problems with housing and food insecurity • More interest in online education • Last-dollar free community college • Slashing tuition rates (i.e. North Carolina Promise) • Extending in-state tuition to out-of-state students, fighting brain drain
Federal Environment • Higher Education Act Reauthorization? • Unfavorable budget request for education, but will likely be ignored • Return of brinksmanship and austerity? • Negotiated rulemaking could usher in new era for higher education
Conclusion • NH will need to make college more affordable through greater investment to meet its future workforce needs • How does the state build a durable coalition to elevate higher education as a state priority?
Questions? Thomas Harnisch Director of State Relations and Policy Analysis AASCU harnischt@aascu.org @aascupolicy
Recommend
More recommend