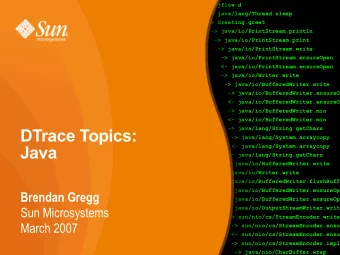
DTrace Topics: xclock 20 xntpd - PowerPoint PPT Presentation
# dtrace -n 'syscall:::entry { @[exe dtrace: description 'syscall:::entry ^C iscsitgtd 1 nscd 1 operapluginclean 3 screen-4.0.2 3 devfsadm
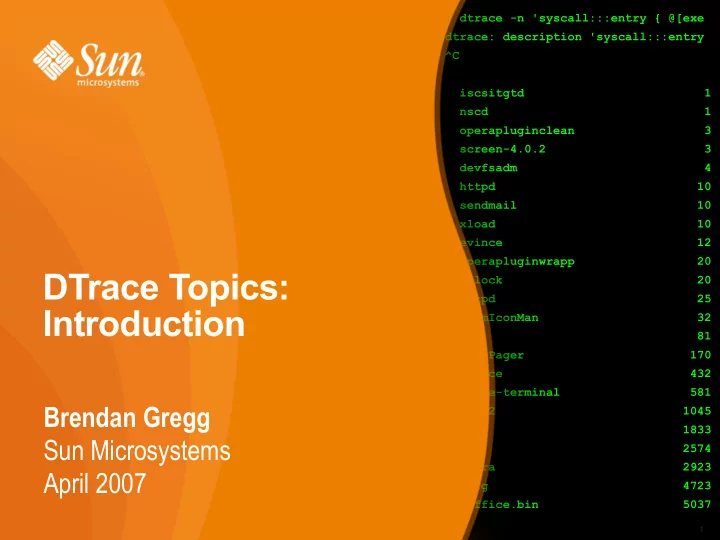
# dtrace -n 'syscall:::entry { @[exe dtrace: description 'syscall:::entry ^C iscsitgtd 1 nscd 1 operapluginclean 3 screen-4.0.2 3 devfsadm 4 httpd 10 sendmail 10 xload 10 evince 12 operapluginwrapp 20 DTrace Topics: xclock 20 xntpd 25 Introduction FvwmIconMan 32 fmd 81 FvwmPager 170 dtrace 432 gnome-terminal 581 Brendan Gregg fvwm2 1045 x64 1833 Sun Microsystems akd 2574 opera 2923 April 2007 Xorg 4723 soffice.bin 5037 1 1
DTrace Topics: Introduction • This presentation is an introduction to DTrace, and is part of the “DTrace Topics” collection. > Difficulty: > Audience: Everyone • These slides cover: > What is DTrace > What is DTrace for > Who uses DTrace > DTrace Essentials > Usage Features 2
What is DTrace • DTrace is a dynamic troubleshooting and analysis tool first introduced in the Solaris 10 and OpenSolaris operating systems. • DTrace is many things, in particular: > A tool > A programming language interpreter > An instrumentation framework • DTrace provides observability across the entire software stack from one tool. This allows you to examine software execution like never before. 3
DTrace example #1 • Tracing new processes system-wide, # dtrace -n 'syscall::exece:return { trace(execname); }' dtrace: description 'syscall::exece:return ' matched 1 probe CPU ID FUNCTION:NAME 0 76044 exece:return man 0 76044 exece:return sh 0 76044 exece:return neqn 0 76044 exece:return tbl 0 76044 exece:return nroff 0 76044 exece:return col 0 76044 exece:return sh 0 76044 exece:return mv 0 76044 exece:return sh 0 76044 exece:return more System calls are only one layer of the software stack. 4
The Entire Software Stack • How did you analyze these? Examples: Java, JavaScript, ... Dynamic Languages /usr/bin/* User Executable /usr/lib/* Libraries man -s2 Syscall Interface VFS, DNLC, UFS, Kernel File Systems ZFS, TCP, IP, ... Memory sd, st, hme, eri, ... allocation Scheduler Device Drivers disk data controller Hardware 5
The Entire Software Stack • It was possible, but difficult: Previously: debuggers Dynamic Languages truss -ua.out User Executable apptrace, sotruss Libraries truss Syscall Interface prex; tnf* Kernel File Systems lockstat Memory mdb allocation Scheduler Device Drivers kstat, PICs, guesswork Hardware 6
The Entire Software Stack • DTrace is all seeing: DTrace visibility: Yes, with providers Dynamic Languages Yes User Executable Yes Libraries Yes Syscall Interface Yes Kernel File Systems Memory allocation Scheduler Device Drivers No. Indirectly, yes Hardware 7
What DTrace is like • DTrace has the combined capabilities of numerous previous tools and more: Tool Capability truss -ua.out tracing user functions apptrace tracing library calls truss tracing system calls prex; tnf* tracing some kernel functions lockstat profiling the kernel mdb -k accessing kernel VM mdb -p accessing process VM Plus a programming language similar to C and awk. 8
Syscall Example • Using truss: Only examine 1 process $ truss date Output is execve("/usr/bin/date", 0x08047C9C, 0x08047CA4) argc = 1 resolvepath("/usr/lib/ld.so.1", "/lib/ld.so.1", 1023) = 12 limited to resolvepath("/usr/bin/date", "/usr/bin/date", 1023) = 13 provided xstat(2, "/usr/bin/date", 0x08047A58) = 0 open("/var/ld/ld.config", O_RDONLY) = 3 options fxstat(2, 3, 0x08047988) = 0 mmap(0x00000000, 152, PROT_READ, MAP_SHARED, 3, 0) = 0xFEFB0000 close(3) = 0 mmap(0x00000000, 4096, PROT_READ|PROT_WRITE|PROT_EXEC, MAP_PRIVATE|MAP_ANON, -1 sysconfig(_CONFIG_PAGESIZE) = 4096 [...] truss slows down the target 9
Syscall Example • Using DTrace: You choose the output # dtrace -n 'syscall:::entry { printf("%16s %x %x", execname, arg0, arg1); }' dtrace: description 'syscall:::entry ' matched 233 probes CPU ID FUNCTION:NAME 1 75943 read:entry Xorg f 8047130 1 76211 setitimer:entry Xorg 0 8047610 1 76143 writev:entry Xorg 22 80477f8 1 76255 pollsys:entry Xorg 8046da0 1a 1 75943 read:entry Xorg 22 85121b0 1 76035 ioctl:entry soffice.bin 6 5301 1 76035 ioctl:entry soffice.bin 6 5301 1 76255 pollsys:entry soffice.bin 8047530 2 [...] Minimum performance cost Watch every process 10
What is DTrace for • Troubleshooting software bugs > Proving what the problem is, and isn't. > Measuring the magnitude of the problem. • Detailed observability > Observing devices, such as disk or network activity. > Observing applications, whether they are from Solaris, 3 rd party, or in-house. • Capturing profiling data for performance analysis > If there is latency somewhere, DTrace can find it 11
What isn't DTrace • DTrace isn't a replacement for kstat or SMNP > kstat already provides inexpensive long term monitoring. • DTrace isn't sentient, it needs to borrow your brain to do the thinking • DTrace isn't “dTrace” 12
Who is DTrace for • Application Developers > Fetch in-flight profiling data without restarting the apps, even on customer production servers. > Detailed visibility of all the functions that they wrote, and the rest of the software stack. > Add static probes as a stable debug interface. • Application Support > Provides a comprehensive insight into application behavior. > Analyze faults and root-cause performance issues. > Prove where issues are, and measure their magnitude. 13
Who is DTrace for • System Administrators > Troubleshoot, analyze, investigate where never before. > See more of your system - fills in many observability gaps. • Database Administrators > Analyze throughput performance issues across all system components. • Security Administrators > Customized short-term auditing > Malware deciphering 14
Who is DTrace for • Kernel Engineers > Fetch kernel trace data from almost every function. > Function arguments are auto-casted providing access to all struct members. > Fetch nanosecond timestamps for function execution. > Troubleshoot device drivers, including during boot. > Add statically defined trace points for debugging. 15
How to use DTrace • DTrace can be used by either: > Running prewritten one-liners and scripts – DTrace one-liners are easy to use and ofter useful, http://www.solarisinternals.com/dtrace – The DtraceToolkit contains over 100 scripts ready to run, http://www.opensolaris.org/os/community/dtrace/dtracetoolkit > Writing your own one-liners and scripts – Encouraged – the possibilities are endless – It helps to know C – It can help to know operating system fundamentals 16
DTrace wins • Finding unnecessary work > Having deep visibility often finds work being performed that isn't needed. Eliminating these can produce the biggest DTrace wins – 2x, 20x, etc. • Solving performance issues > Being able to measure where the latencies are, and show what their costs are. These can produce typical performance wins – 5%, 10%, etc. 17
DTrace wins • Finding bugs > Many bugs are found though static debug frameworks; DTrace is a dynamic framework that allows custom and comprehensive debug info to be fetched when needed. • Proving performance issues > Many valuable DTrace wins have no immediate percent improvement, they are about gathering evidence to prove the existence and magnitude of issues. 18
Example scenario: The past • Take a performance issue on a complex customer system, Customer: “Why is our system slow?” • With previous observability tools, customers could often find problems but not take the measurements needed to prove that they found the problem. > What is the latency cost for this issue? As a percent? 19
Example scenario: The past Application Vendor: “The real problem may be the database.” Database Vendor: “The real problem may be the OS.” OS Vendor: “The real problem may be the application.” • The “blame wheel” 20
Example scenario: The past Customer: “I think I've found the issue in the application code.” Application Vendor: “That issue is costly to fix. We are happy to fix it, so long as you can prove that this is the issue.” • The lack of proof can mean stalemate. 21
Recommend
More recommend
Explore More Topics
Stay informed with curated content and fresh updates.
