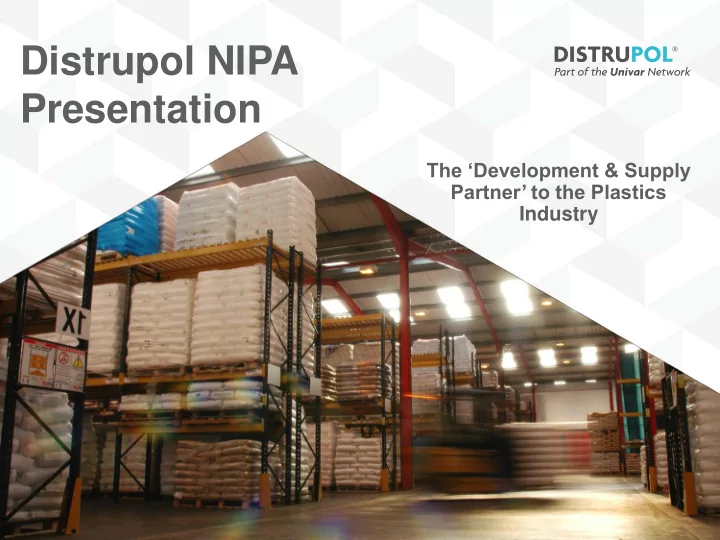

Distrupol NIPA Presentation The ‘Development & Supply Partner’ to the Plastics Industry
Leading European Supply Partners
Pricing and Trends in Commodity Polymers • Oil and Gas to Plastics • Polymer Consumption Growth by Region • Pricing Relationships and Trends • Impact of Shale Gas Development • The Changing World of Propylene • Conclusions 4
Polymers from Oil Other Polymers - 4% Petrochemicals Industry Power Other Generation Domestic Transportation 5
Petrochemical Feedstock Sources 6
Yield from Crude Oil Crude Oil <29 C Gases Distillation Methane (65-90%) Ethane, Propane, Butane Gasolines (C5/C6) 70 C (70-140C) 140 C Naphtha- Heavy (C7/C9) Crude (140-200C) Boiling Point Atmspheric Gas Oil Oil 200 C Kerosene (C9/C16) (175-275C) Diesel Fuel (C15/C25) 300 C (200-370) Heavy Fractions >370 C Lubricating Oil Heavy Fuel Oil Asphalt
Cracking Naphtha Hydrogen Methane Naphtha Quench Compressors Furnace Ethylene Boiler Steam Propylene Gasoline Fuel Oil Butadiene Primary Distillation Boiler feed Fractionator Columns water 8
Monomer Yield by Feedstock 100% Other Hydrocarbons 75% Butadiene 50% Propylene 25% Ethylene 0% Ethane Propane Butane Naphtha Gasoil 9
Feedstock Source by Region 100% Ethane 80% Propane 60% Butane 40% Naphtha 20% Gasoil 0% Western Europe Japan USA 10
Ethylene (C2) to Polyethylene H H H H H H H H H H C=C C=C C=C C C C C H H H H H H H H H H Polyethylene Ethylene 11
Polymers from Monomers Petrochemical Feedstock Other Feedstock Intermediate Polymer Benzene Ethylene Paraxylene Propylene Ethylbenzene Chlorine PTA Styrene EDC PET GP Polystyrene VCM BR EO MEG PVC HI Polystyrene PP Co PP Homo LDPE LLDPE HDPE 12
Global Polymer Demand 13
Polymer Growth by Region 1983 - 2011 14
Forecast Growth by Region to 2016 15
Comments on Pricing • Current pricing is predominantly influenced by Feedstock prices • Crude Oil Prices have remained high • Supply issues with Crackers have meant high monomer values • Crude normally traded in $’s, so currency movements affect feedstock values • Overall global supply/demand balance strongly influenced by Chinese growth rates 16
Polyolefins Historic Pricing 17
Shale Gas Development 18
US Shale Gas Drilling Projects 19
% of US Ethylene from different sources 20
Gas Vs Oil Disconnect 21
The Changing World of Propylene • Shift to Ethane feedstock in North America – Shale Gas • Emphasis on continued use of Ethane in Middle East • Limited co-product supply • Ethylene derivatives in surplus – propylene shortage • Limited availability of propylene within refinery systems in North America and Europe • Forecast demand growth implies propylene must be sourced elsewhere • Propane Dehydrogenation in ME and US • Refineries and Coal in Asia • Higher investment costs imply higher propylene values 22
PDH Projects across the world 23
Conclusions • Pricing in Commodity Polymer Markets are currently driven by feedstock prices • Main driver for Feedstock Prices are Oil/Gas prices and Exchange Rates • Shale Gas developments in North America will lead to a significant cost advantage for C2 producers there • North America will become a significant exporter of Ethylene derivatives • Move to Ethane from Shale Gas for Ethylene will lead to shortage of Propylene, with oversupply of Ethylene • Non-traditional routes to Propylene are more expensive, so price differential between C2 and C3 will increase 24
A Polymer for every Application
Recommend
More recommend