
SLIDE 1
1
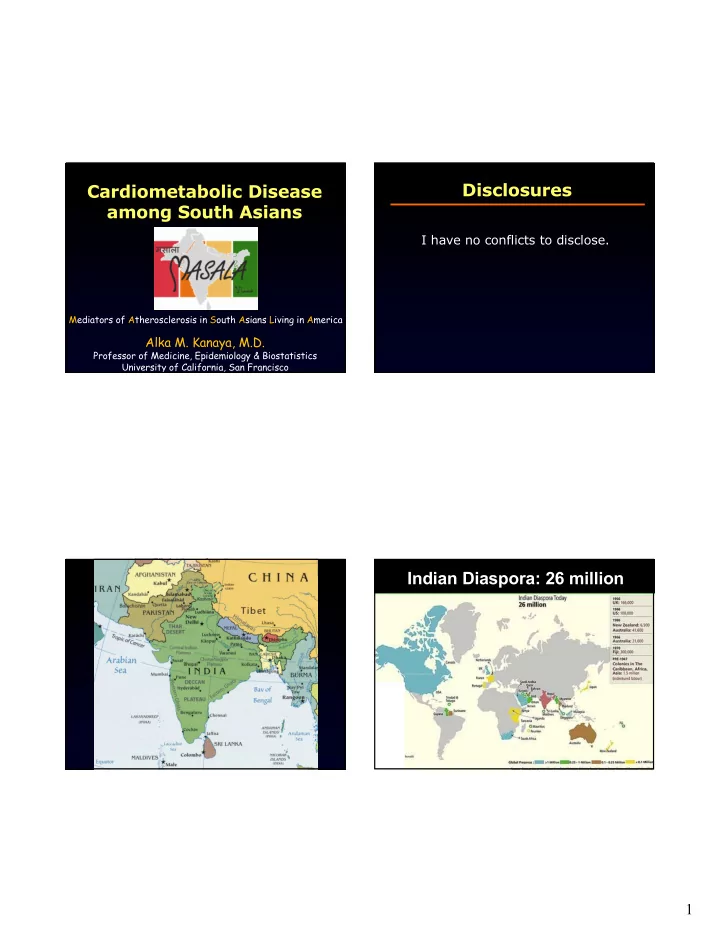
Cardiometabolic Disease among South Asians
Alka M. Kanaya, M.D.
Professor of Medicine, Epidemiology & Biostatistics University of California, San Francisco Mediators of Atherosclerosis in South Asians Living in America
Disclosures Cardiometabolic Disease among South Asians I have no - - PDF document
Disclosures Cardiometabolic Disease among South Asians I have no conflicts to disclose. Mediators of Atherosclerosis in South Asians Living in America Alka M. Kanaya, M.D. Professor of Medicine, Epidemiology & Biostatistics University of
Professor of Medicine, Epidemiology & Biostatistics University of California, San Francisco Mediators of Atherosclerosis in South Asians Living in America
U.S. Census Bureau
US Census Bureau, 2015 ACS
Palaniappan, Annals Epi, 2004
v 126,905 members v health exam, 1978-1985 v 7 race/ethnic groups v followed for 17.4 years v Outcome: CAD hospital. v Adjusted for age, sex, smoking, alcohol, BMI, education, marital status, cardiorespiratory composite, SBP, total cholesterol, glucose, WBC
Hajra, JACC, 2013
84% 5% 1% 1% 1%
3% Africa 2% U.S. 2% Fiji 2% other Diaspora country
0-10 11-20 21-30 31-40 >40 0-20 21-40 41-60 61-80 >80
SA N=906 White n=2622 Black n=1893 Latino n=1496 Chin. n=803
* p<0.001 in comparison to South Asians, adjusted by sex and age
SA N=906 White n=2622 Black n=1893 Latino n=1496 Chin. n=803 Current Smoker
Alcohol
1+ drinks/week
Exercise
MET-min/week
TV watching
Hours/week
* p<0.001 in comparison to South Asians, adjusted by sex and age
Animal protein Fried snacks, sweets, and high fat dairy Fruits, vegetables, nuts, and legumes
Western diet Fruits and Vegetables Sweets and Refined Grains Meat, eggs, pasta, pizza, refined grains, alcohol, low-fat dairy, coffee butter, ghee, fried snacks, high-fat dairy, refined grains, rice, potatoes fresh fruit, vegetables, legumes, low-fat dairy, nuts, whole grains
Gadgil, J Nutrition, 2015
Fruits & Veggies Sweets & Refined Grains Animal protein p Female sex 58 46 37 <0.001 Years in the U.S. 28 ± 10 25 ± 11 28 ± 11 0.67 Income >$75K 77 66 78 0.001 Religion: Hinduism Islam Sikhism 37 8 28 36 26 35 27 66 37 <0.001 <0.001 0.01
Gadgil, J Nutrition, 2015
Fruits & Veggies Sweets & Refined Grains Animal protein BMI
(reference) NS 0.92, p<0.05
WHR
0.02, p<0.001
HOMA-IR
NS
HDL
NS
TG
NS
Fasting Glucose
NS
*adjusted for age, sex, site, and total caloric intake
Lancet, WHO expert panel, 2004
Lancet, 2004
Shah, Intl J Obes, 2016
Prevalence Ratio (95% CI) Unadjusted Multivariate Adjusted* Race/Ethnicity White 1.00 (Reference) 1.00 (Reference) South Asian 2.07 (1.69, 2.55) 2.53 (1.99, 3.22) Chinese 1.53 (1.25, 1.88) 1.27 (1.02, 1.59) African American 1.48 (1.20, 1.82) 1.66 (1.35, 2.04) Hispanic 1.83 (1.49, 2.24) 1.56 (1.26, 1.92)
* adjusted for age, sex, education, alcohol use, smoking status, physical activity, daily caloric intake, hepatic fat attenuation, and pericardial fat volume Gujral, Annals Int Med, 2017
Race/ethnic-specific BMI values associated with same prevalence of metabolic abnormalities as Whites with BMI 25
South Asian Chinese Hispanic African American White
BMI (kg/m2)
25 19.6 20.921.5 22.9
Prevalence (%)
100 90 80 70 60 50 40 30 20 10
Gujral, Annals Int Med, 2017
0% 2% 4% 6% 8% 10% 12% 14% 16% 16 18 20 22 24 26 28 30 32 34 36 38 40 49
Men Women
BMI (kg/m2)
37% women and 21% men with T2DM had BMI <25 kg/m2
Araneta, Diabetes Care, 2015
Proportion who would not be screened
Hsu, Diabetes Care, 2015
Normal PreDM T2DM
33.1 80.6 65.4 61.9 65.5 55.6 86.5 70.5 73.5 74.0 37.1 12.5 16.2 17.9 20.3 29.0 8.8 12.2 12.4 13.8 29.8 6.9 18.4 20.2 14.2 15.4 4.7 17.3 14.1 12.2 0% 20% 40% 60% 80% 100%
Normal IFG DM
South Asian n=799 White n=2,611 African American n=1,879 Latino n=1,493 Chinese American n=801 Crude prevalence, %
21.1 (18.3-24.0) 6.0* (5.1-7.0) 17.7** (15.9-19.4) 17.7** (15.7-19.6) 13.1* (10.8-15.4)
Fully adjusted†
26.7 (21.2-32.3) 6.3* (5.3-7.3) 16.4** (14.5-18.3) 14.4* (12.6-16.3) 16.0* (12.9-19.1)
* p<0.05; **p<0.001 compared to South Asians †adjusted for age, sex, clinical site, education, family income, smoking, alcohol use, exercise, BMI, waist circumference, HDL-cholesterol, triglycerides, hypertension, and fasting insulin
Kanaya, Diabetes Care, 2014
** ** ** *
Excludes those on diabetes meds Adjusted for age, sex, BMI, waist * p<0.05 **p<0.001 compared to SA
** ** ** **
Gujral, Diabetes Care, 2015
100 200 300 400 50 100 40 50 60 70 80 40 50 60 70 80
Men Women South Asians Whites African Americans Latinos Chinese Age (years)
P-for-interaction by sex = 0.002
Kanaya, Atherosclerosis, 2014
MEN WOMEN
Kanaya, AHA moderated poster, 2017
grains, and low-fat dairy
0.023 (0.004-0.41, p=0.02)
0.022 (0.003-0.042, p=0.03)
0.018 (0.002-0.035; p=0.03)
0.017 (0.001-0.034; p=0.04)
*Even after accounting for all other risk factors, diet and exercise
Shah B, J Immigr Minor Health, 2016
religious engagements
markets
Cronbach’s α: 0.83
v Traditional cultural beliefs:
v Independent of age, sex, years lived in the US, study site, alcohol use, waist, HDL, physical activity, total caloric intake, and cholesterol medication use
v Years lived in the U.S.:
residence
Kanaya, J Clin Exp Res Cardiol, 2014