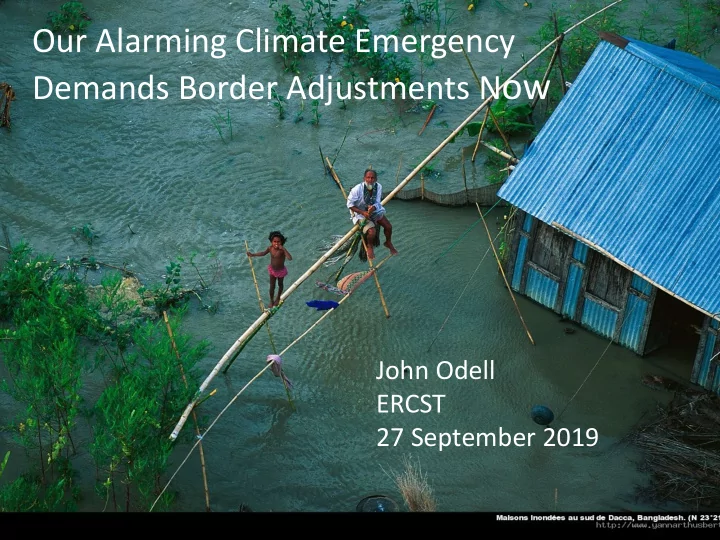

Our Alarming Climate Emergency Demands Border Adjustments N ow John Odell ERCST 27 September 2019
A new proposal for border carbon adjustments Primary goal: induce governments of high-polluting countries to improve their policies to reduce GHG pollution. Core idea: Each country or customs union that imposes positive net taxes on fossil fuel use at home should extend the same treatment to all goods it imports--unilaterally if necessary. BCA = All “FF tax” paid on a like home good minus all “FF tax” already paid on the imported good along its supply chain
A COMPLETE VERSION SHOULD SATISFY 3 PRINCIPLES Exempt low-emitting countries • Compatible with WTO law • Minimize new transaction costs •
154 US 154 US f firms p pledged t to f fight cl climate ch change i in 2015 2015 ALCOA GOOGLE APPLE KELLOGG’S BANK OF AMERICA IKEA BERKSHIRE HATHAWAY LEVI STRAUSS ENERGY MICROSOFT CARGILL PG&E COCA-COLA SIEMENS DELL TARGET FACEBOOK GENERAL MOTORS UPS GOLDMAN SACHS WALMART
Country CO2 per capita 2014 Total CO2 2015 Energy tax rate Metric tonnes per capita Territorial emissions in Euros per tonne of CO2 million tonnes CO₂ emissions Qatar 45.4 91.0 Trinidad and Tobago 34.2 45.0 Kuwait 25.2 102.0 Bahrain 23.4 33.0 United Arab Emirates 23.3 177.0 Brunei Darussalam 22.1 9.1 Saudi Arabia 19.5 600.5 Luxembourg (EU28) 17.4 10.0 93.64 United States 16.5 5,413.6 4.83 HIGHLY- Oman 15.4 63.0 Australia 15.4 399.7 19.55 Canada 15.1 557.0 7.72 POLLUTING Estonia (EU28) 14.8 20.0 25.70 Kazakhstan 14.4 235.0 Turkmenistan 12.5 91.0 COUNTRIES Palau 12.3 0.2 Russian Federation 11.9 1,617.3 0.01 Korea, Rep. 11.6 592.2 26.47 Singapore 10.3 55.0 Netherlands (EU28) 9.9 162.0 87.98 Japan 9.5 1,237.3 37.41 Norway 9.3 44.0 93.25 Czech Republic (EU28) 9.2 96.0 31.55 Libya 9.2 54.0 South Africa 9.0 462.2 13.86 To find this online, Germany (EU28) 8.9 798.3 58.26 Finland (EU28) 8.7 44.0 60.18 search “alarming Belgium (EU28) 8.3 100.0 45.63 climate border.” Iran, Islamic Rep. 8.3 647.5 Malaysia 8.0 249.0 Israel 7.9 72.0 73.33 New Zealand 7.7 36.0 31.33 Poland (EU28) 7.5 315.8 25.50 China 7.5 10,357.1 3.40 Ireland (EU28) 7.4 37.0 77.13 Ref: OECD MEDIAN 7.15
ILLUSTRATIONS Country CO2 per capita 2014 Total CO2 2015 Energy tax rate Metric tonnes per capita Territorial emissions in Euros per tonne of CO2 million tonnes CO₂ emissions United States 16.5 5,413.6 4.83 Russian Federation 11.9 1,617.3 0.01 Japan 9.5 1,237.3 37.41 Norway 9.3 44.0 93.25 Germany (EU28) 8.9 798.3 58.26 China 7.5 10,357.1 3.40 Ref: OECD MEDIAN 7.15 Ref: European Union 6.4 France (EU28) 4.6 339.9 61.12 Gabon and WORLD MEDIAN 2.8 5.0 India 1.7 2,274.3 3.12
WHY NOT DESIGN BCAs ACCORDING TO CARBON FOOTPRINTS? • The goal is more than stopping carbon leakage: policy change in high-polluting countries • More effective for that goal: a) direct incentive for governments, and b) reach behind-the-border emissions
CO COMPATIBLE WITH WTO
MI MINIMI MIZE T E TRANSACTION ON C COS OSTS
• Stage 1: set a default BCA for motors using VAT administration • Stage 2: authorize customs to deduct from the default rate for documented mitigation costs applied to imports throughout their supply chains
Hamburg port and fish market 2019
Recommend
More recommend