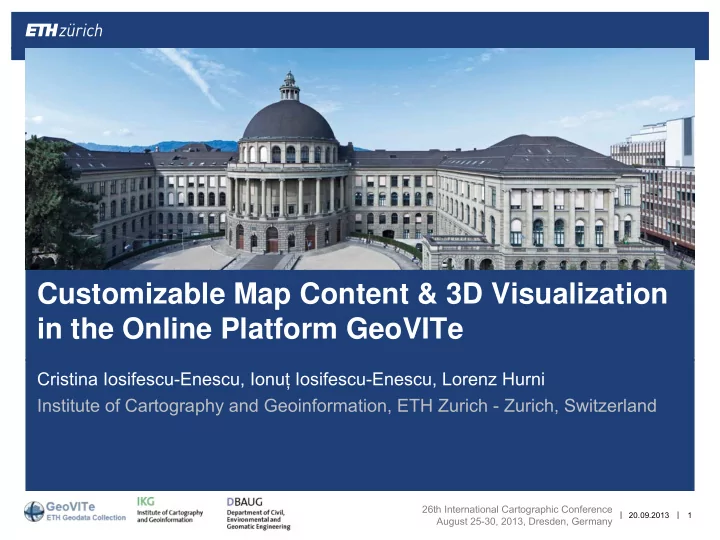

Customizable Map Content & 3D Visualization in the Online Platform GeoVITe Cristina Iosifescu-Enescu, Ionu ț Iosifescu-Enescu, Lorenz Hurni Institute of Cartography and Geoinformation, ETH Zurich - Zurich, Switzerland 26th International Cartographic Conference | 20.09.2013 | 1 August 25-30, 2013, Dresden, Germany
Outline GeoVITe Project – Overview Visualization Selection Download Geoportals powered by GeoVITe Customizable Map Content 3D on Demand Customizable Visualization Symbolization by means of SLD Time navigation C. Iosifescu, I. Iosifescu & L. Hurni | 20.09.2013 | 2
GeoVITe Web-platform for visualization, geodata selection and download Official distribution channel for geodata in the ETH- Domain for research and educational purposes Geo data V isualization and I nteractive T raining E nvironment C. Iosifescu, I. Iosifescu & L. Hurni | 20.09.2013 | 3
https://geodata.ethz.ch/geovite C. Iosifescu, I. Iosifescu & L. Hurni | 20.09.2013 | 4
C. Iosifescu, I. Iosifescu & L. Hurni | 20.09.2013 | 5
GeoVITe Visualization WMS Services Map navigation Geocoding Service Geodata Selection Product categories Product information & link to detailed description Download Selection of the extent (dataframe) Geoprocessing Services: Clip, Reprojection, File format change Download Cart C. Iosifescu, I. Iosifescu & L. Hurni | 20.09.2013 | 6
Novel Functionalities Customizable Map Content 3D on Demand Customizable Visualization Symbolization by means of SLD Symbolization of SVG point and raster data Time navigation C. Iosifescu, I. Iosifescu & L. Hurni | 20.09.2013 | 7
Geoportals powered by GeoVITe OSPER/SwissExperiment Objective: to provide a platform for large scale sensor network deployment and information retrieval and exploitation GeoIDEA.ro Objective: to implement a geoportal allowing the access to geodata in Romania in a usable format and under an open license GeoHistory Objective: to facilitate the comparison between historical maps (17th-20th cent.) with modern raster and vector data, therefore making possible to observe and study the changes which took place in the area Canton of Zurich over time C. Iosifescu, I. Iosifescu & L. Hurni | 20.09.2013 | 8
Customizable Map Content Add layers from different map categories Adjust transparency and modify layer order Facilitates map comparison C. Iosifescu, I. Iosifescu & L. Hurni | 20.09.2013 | 9
Map comparison in GeoHistory C. Iosifescu, I. Iosifescu & L. Hurni | 20.09.2013 | 10
3D on Demand Two ways of 3D visualization WebGL Terrain Bender Terrain data automatically chosen from the available digital elevation/surface models a function of the scale of the map extent/map product Map data current map extent (from WMS) for WebGL downloaded original data for Terrain Bender C. Iosifescu, I. Iosifescu & L. Hurni | 20.09.2013 | 11
3D visualization in browser using WebGL C. Iosifescu, I. Iosifescu & L. Hurni | 20.09.2013 | 12
C. Iosifescu, I. Iosifescu & L. Hurni | 20.09.2013 | 13
3D visualization with JavaWebStart software Terrain Bender C. Iosifescu, I. Iosifescu & L. Hurni | 20.09.2013 | 14
C. Iosifescu, I. Iosifescu & L. Hurni | 20.09.2013 | 15
Customizable visualization Customizable visualization with Styled Layer Descriptor (SLD) Customizable visualization for SVG point and raster data SVG data generated on-the-fly Sensor data from dynamically updating data-bases Automatic refresh function Time navigation C. Iosifescu, I. Iosifescu & L. Hurni | 20.09.2013 | 16
Customizable visualization with SLD C. Iosifescu, I. Iosifescu & L. Hurni | 20.09.2013 | 17
Customizable visualization for SVG point data C. Iosifescu, I. Iosifescu & L. Hurni | 20.09.2013 | 18
Customizable visualization for SVG raster data C. Iosifescu, I. Iosifescu & L. Hurni | 20.09.2013 | 19
Time navigation C. Iosifescu, I. Iosifescu & L. Hurni | 20.09.2013 | 20
Thank you for your attention! Questions?
Recommend
More recommend