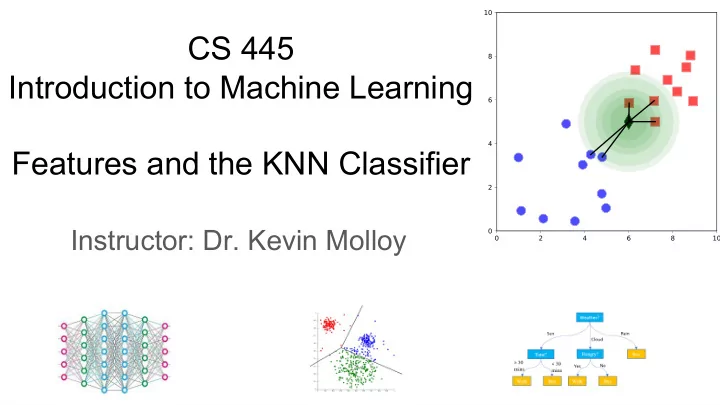

CS 445 Introduction to Machine Learning Features and the KNN Classifier Instructor: Dr. Kevin Molloy
Quick Review of KNN Classifier If it walks like a duck, and quacks like a duck, it probably is a duck. k = 5 k = 1
Distance (dissimilarity) between observations Define a method to measure the distance between two observations. This distance incorporates all the features at once. Idea : Small distances between observations imply similar class labels. Euclidean Distance and Nearest Point Classifier 1. Compute distance from new point p point Dist to p (the black diamond) and the training 1 2.45 set. 2 1.30 3 0.99 2. Identify the nearest point and assign … … its label to point p n 8.23
Decision Boundaries Boundaries are perpendicular (orthogonal) to the feature being split. What do the KNN decision boundaries look like?
Where is the model?
High Dimensionality Lab Complete Question 1 and the Activity 2. Take 12 minutes.
Features – The more the better, right? Start with a single feature (real number) dataset with values in the range [0, 5]. Question : What is the minimal number of data points to cover the unit interval (that is, at least one sample for each unit (1) on a line? Question : Now, increase that to two-dimensional. How many data points? In general, 5 d examples minimally cover the space such that each example has another 5 2 samples example less than 1 unit away.
KNN Implications How will KNN perform with 1,000 data points (X) with 3 features (X has 3 columns)? ● Experiment . Generate data with 3 dimensions, each data value is between 0 and 1. ● Most points have another point close by, so, it has a chance of generalizing (but not guaranteed, why?) How will KNN perform with 1,000 data points (X) with 8 features (X has 8 columns)? The distance between a point and its closest neighbor has increased.
KNN Implications How will KNN perform with 1,000 data points (X) with 25 features (X has 25 columns)? ● All points are similar distances away. Nothing is close by and all points look the same. ● Solution is to add data? ● Nope . Increasing the dataset size by 10 times makes almost no difference
Curse of Dimensionality https://en.wikipedia.org/wiki/Curse_of_dimensionality Given a point p , the distances to all other points in the dataset is fairly uniform and far away. Richard Bellman
Lowering the Dimensionality Idea : Try a subset of the features. By how many subsets are there for 30 features? Imagine a binary string, each position in the string represents a feature: 0 = exclude, 1 = include. 2 d features! For 30 features, we have 1 billion different combinations! Trying all the combinations of features is too computationally expensive. However, this is the only way we know of right now to find the "best" set of features.
Greedy Approximation (again) Forward selection : 1. Evaluate each individual feature, pick the one that 1 2 3 4 performs the best on validation data. 1,2 3,4 1,3 2,3 1,4 2,4 2. Now try adding all single features. Did it improve, 1,3,4 2,3,4 1,2,4 1,2,3 repeat, Otherwise stop. 1,2,3,4
Confidence in Decisions Question : For any given prediction p , should I have the same confidence that my prediction is correct?
For Next Time ● I will send out some information about the exam before next class (the exam is next Thursday). ● PA 1 is due next Tuesday. ● Next class we are going to discuss comparing decision trees and KNN in more ways.
Recommend
More recommend