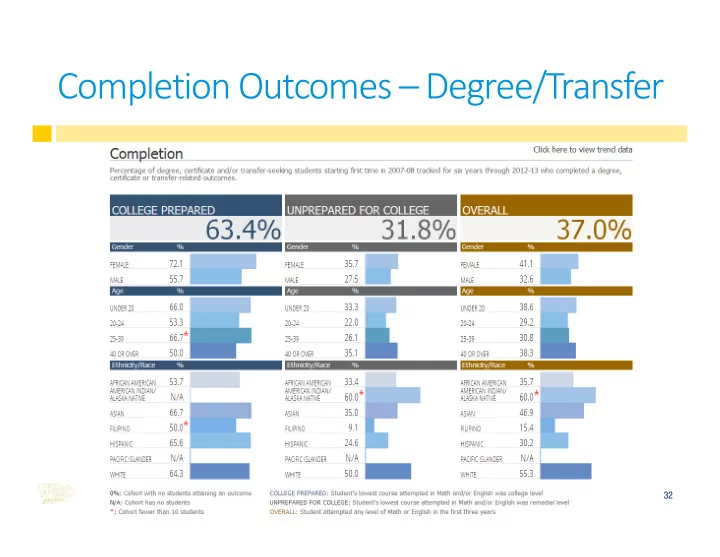

Completion Outcomes – Degree/Transfer 32
Momentum Points ‐ Persistence 33
Momentum Points – 30 Units 34
Momentum Points ‐ Remedial 35
Completion Outcomes – CTE 36
California Community Colleges Chancellor's Office 2014 Score Card Metric Summary Report: Completion (SPAR) by Rank of Percent of Student Who Are Unprepared Cohort Year Cohort Year % % 2007-2008 Completion 2007-2008 Completion Percent of Unprepared Rank Percent of Unprepared Rank (Outcomes by Rank (Outcomes by Rank Unprepared* Rank Difference Unprepared* Rank Difference 2012-2013) 2012-2013) Moorpark 61.03% 7 Sacramento City 51.65% 28 39.72% 1 -6 76.13% 57 29 Santa Barbara 62.35% 5 Sequoias 42.84% 79 47.48% 2 -3 76.80% 58 -21 MiraCosta 55.89% 16 51.43% 3 -13 Cosumnes River 46.92% 53 76.86% 59 6 Orange Coast 61.53% 6 Lake Tahoe 46.08% 58 53.30% 4 -2 76.96% 60 2 Saddleback 57.04% 13 Skyline 47.68% 48 55.24% 5 -8 77.02% 61 13 Foothill 64.27% 2 Folsom Lake 47.18% 50 56.69% 6 4 77.18% 62 12 Irvine 62.74% 4 57.91% 7 3 Siskiyous 42.97% 78 77.19% 63 -15 Ventura 54.29% 19 Butte 44.92% 65 59.07% 8 -11 77.22% 64 -1 Glendale 54.24% 21 Cypress 46.74% 54 59.53% 9 -12 77.26% 65 11 Santiago Canyon 55.74% 17 Canyons 58.57% 9 59.57% 10 -7 77.27% 66 57 Coastline 52.76% 23 Monterey 51.97% 27 60.82% 11 -12 77.88% 67 40 West Valley 56.77% 14 Chabot Hayward 49.10% 41 61.09% 12 -2 78.25% 68 27 Feather River 49.17% 39 Oxnard 43.63% 68 61.16% 13 -26 78.37% 69 1 Sierra 49.10% 40 63.01% 14 -26 Reedley College 45.95% 60 78.73% 70 10 Allan Hancock 45.33% 62 Mt San Antonio 47.13% 51 63.03% 15 -47 78.90% 71 20 San Diego Mesa 60.97% 8 Lassen 38.31% 98 64.38% 16 8 79.03% 72 -26 Diablo Valley 58.55% 10 Antelope Valley 43.52% 70 64.91% 17 7 79.50% 73 3 Shasta 39.16% 96 Fresno City 41.69% 87 66.49% 18 -78 79.63% 74 -13 LA Valley 42.27% 85 80.11% 75 ‐ 10 Santa Rosa 54.40% 18 66.58% 19 1 Evergreen Valley 50.52% 34 Modesto 42.43% 84 66.83% 20 -14 80.55% 76 -8 Pasadena 52.53% 24 67.83% 21 -3 Los Medanos 43.11% 74 81.01% 77 3 Deanza 66.91% 1 West Hills Coalinga 44.99% 64 68.09% 22 21 81.12% 78 14 Columbia 44.32% 66 Citrus 46.38% 56 68.21% 23 -43 81.26% 79 23 Berkeley City 46.55% 55 Yuba 39.90% 91 68.32% 24 -31 81.29% 80 -11 LA Pierce 50.68% 32 81.53% 81 49 Cabrillo 48.78% 43 68.41% 25 -18 LA Harbor 39.94% 89 81.61% 82 ‐ 7 Mission 48.54% 44 68.83% 26 -18 Gavilan 43.01% 76 Grossmont 50.44% 35 68.96% 27 -49 81.70% 83 48 Napa 51.04% 31 69.10% 28 -3 Porterville 45.23% 63 83.02% 84 21 Golden West 52.09% 26 Mendocino 38.00% 99 69.17% 29 3 83.11% 85 -14 Solano 45.76% 61 Merced 37.25% 101 69.90% 30 -31 83.29% 86 -15 Santa Monica 47.71% 47 Imperial 43.58% 69 70.03% 31 -16 83.47% 87 18 West LA 37.01% 102 83.56% 88 ‐ 14 San Diego Miramar 53.56% 22 70.06% 32 10 Las Positas 57.83% 12 Chaffey 42.71% 80 70.18% 33 21 83.66% 89 9 Contra Costa 46.93% 52 Cuyamaca 47.51% 49 70.35% 34 -18 83.72% 90 41 Ohlone 58.44% 11 Bakersfield 39.94% 90 70.36% 35 24 84.04% 91 1 Canada 49.20% 38 Mt. San Jacinto 42.46% 83 70.48% 36 -2 84.08% 92 9 Cuesta 51.26% 30 Rio Hondo 37.89% 100 70.74% 37 7 85.45% 93 -7 Laney 48.93% 42 Riverside 39.71% 93 71.13% 38 -4 85.64% 94 1 Redwoods 43.00% 77 71.25% 39 -38 Taft 34.43% 103 86.18% 95 -8 Santa Ana 46.04% 59 San Francisco 55.98% 15 71.62% 40 -19 86.89% 96 81 San Jose City 44.28% 67 Desert 38.43% 97 71.71% 41 -26 87.32% 97 0 Alameda 51.51% 29 Barstow 43.15% 73 71.90% 42 13 87.56% 98 25 El Camino East LA 41.75% 86 87.83% 99 13 48.22% 45 72.22% 43 -2 Palomar 50.63% 33 Hartnell 43.32% 72 72.23% 44 11 88.05% 100 28 LA City 39.40% 95 88.65% 101 6 San Mateo 52.50% 25 72.54% 45 20 American River 43.08% 75 72.63% 46 -29 Long Beach 42.67% 81 88.78% 102 21 Cerro Coso 49.78% 37 Cerritos 41.30% 88 72.71% 47 10 89.19% 103 15 Merritt 46.15% 57 Palo Verde 30.63% 109 73.08% 48 -9 90.09% 104 -5 Compton San Diego City 63.67% 3 31.21% 107 73.29% 49 46 90.20% 105 -2 LA Trade 32.76% 106 91.01% 106 0 San Joaquin Delta 47.72% 46 73.92% 50 4 Fullerton 49.85% 36 Victor Valley 39.70% 94 74.26% 51 15 91.22% 107 13 Southwestern 43.52% 71 San Bernardino 33.47% 104 75.05% 52 -19 91.68% 108 4 LA Mission 33.26% 105 91.71% 109 4 Marin 54.26% 20 75.47% 53 33 LA Swest 31.19% 108 93.32% 110 2 Copper Mountain 26.80% 110 75.69% 54 -56 West Hills Lemoore 42.54% 82 75.71% 55 -27 Crafton Hills 39.81% 92 * 75.91% 56 -36 (OC% - PC%) / (UC%-PC%)
Recommend
More recommend